Overview and Motivation
In the first part of this CV project, I used techniques such as Cross Correlation and K-Means Clustering to scan and detect archaeological sites from aerial images. The motivation for this project stemmed from learning how aerial survey works, and discovering ways to improve aerial survey methods on specific archaeological sites Using Machine Learning techniques to help archaeologists discover sites for excavation. the algorithm can train on certain test images, and I provide sample archaeological sites as templates to be used in cross correlation. It then detects potential regions where an archaeological site may be.
The second part of this project is using the K-Means clustering algorithm on Sample locations in order to hone in on potential regions where there is a high likelihood of finding a new archaeological site. This method of "finding high likelihood regions" lies on the assumption that archaeological sites are usually located around other archaeological sites. or in other words, if you find many archaeological sites in an area, then the next best area to look to find another archaeological site is at the mean-centered average location of all the currently discovered archaeological sites within that area. This assumption is based on the idea that in antiquity and throughout history, human settlement has been generally clustered, and so it makes sense to use a k-Means Clustering algorithm on known sites to discover centers where other sites are likely to be found.
It is important to note that the K-means algorithm assumption does not only apply to a collection of sites, but also findings within an individual site as well. to illustrate, if archaeologists are excavating a site and have found an n number of findings or artifacts, then a good next place to check would be at the cluster centers of those N findings. This method can also be used quickly and efficiently for archaeologists on site to locate potential spots for excavation within a site.
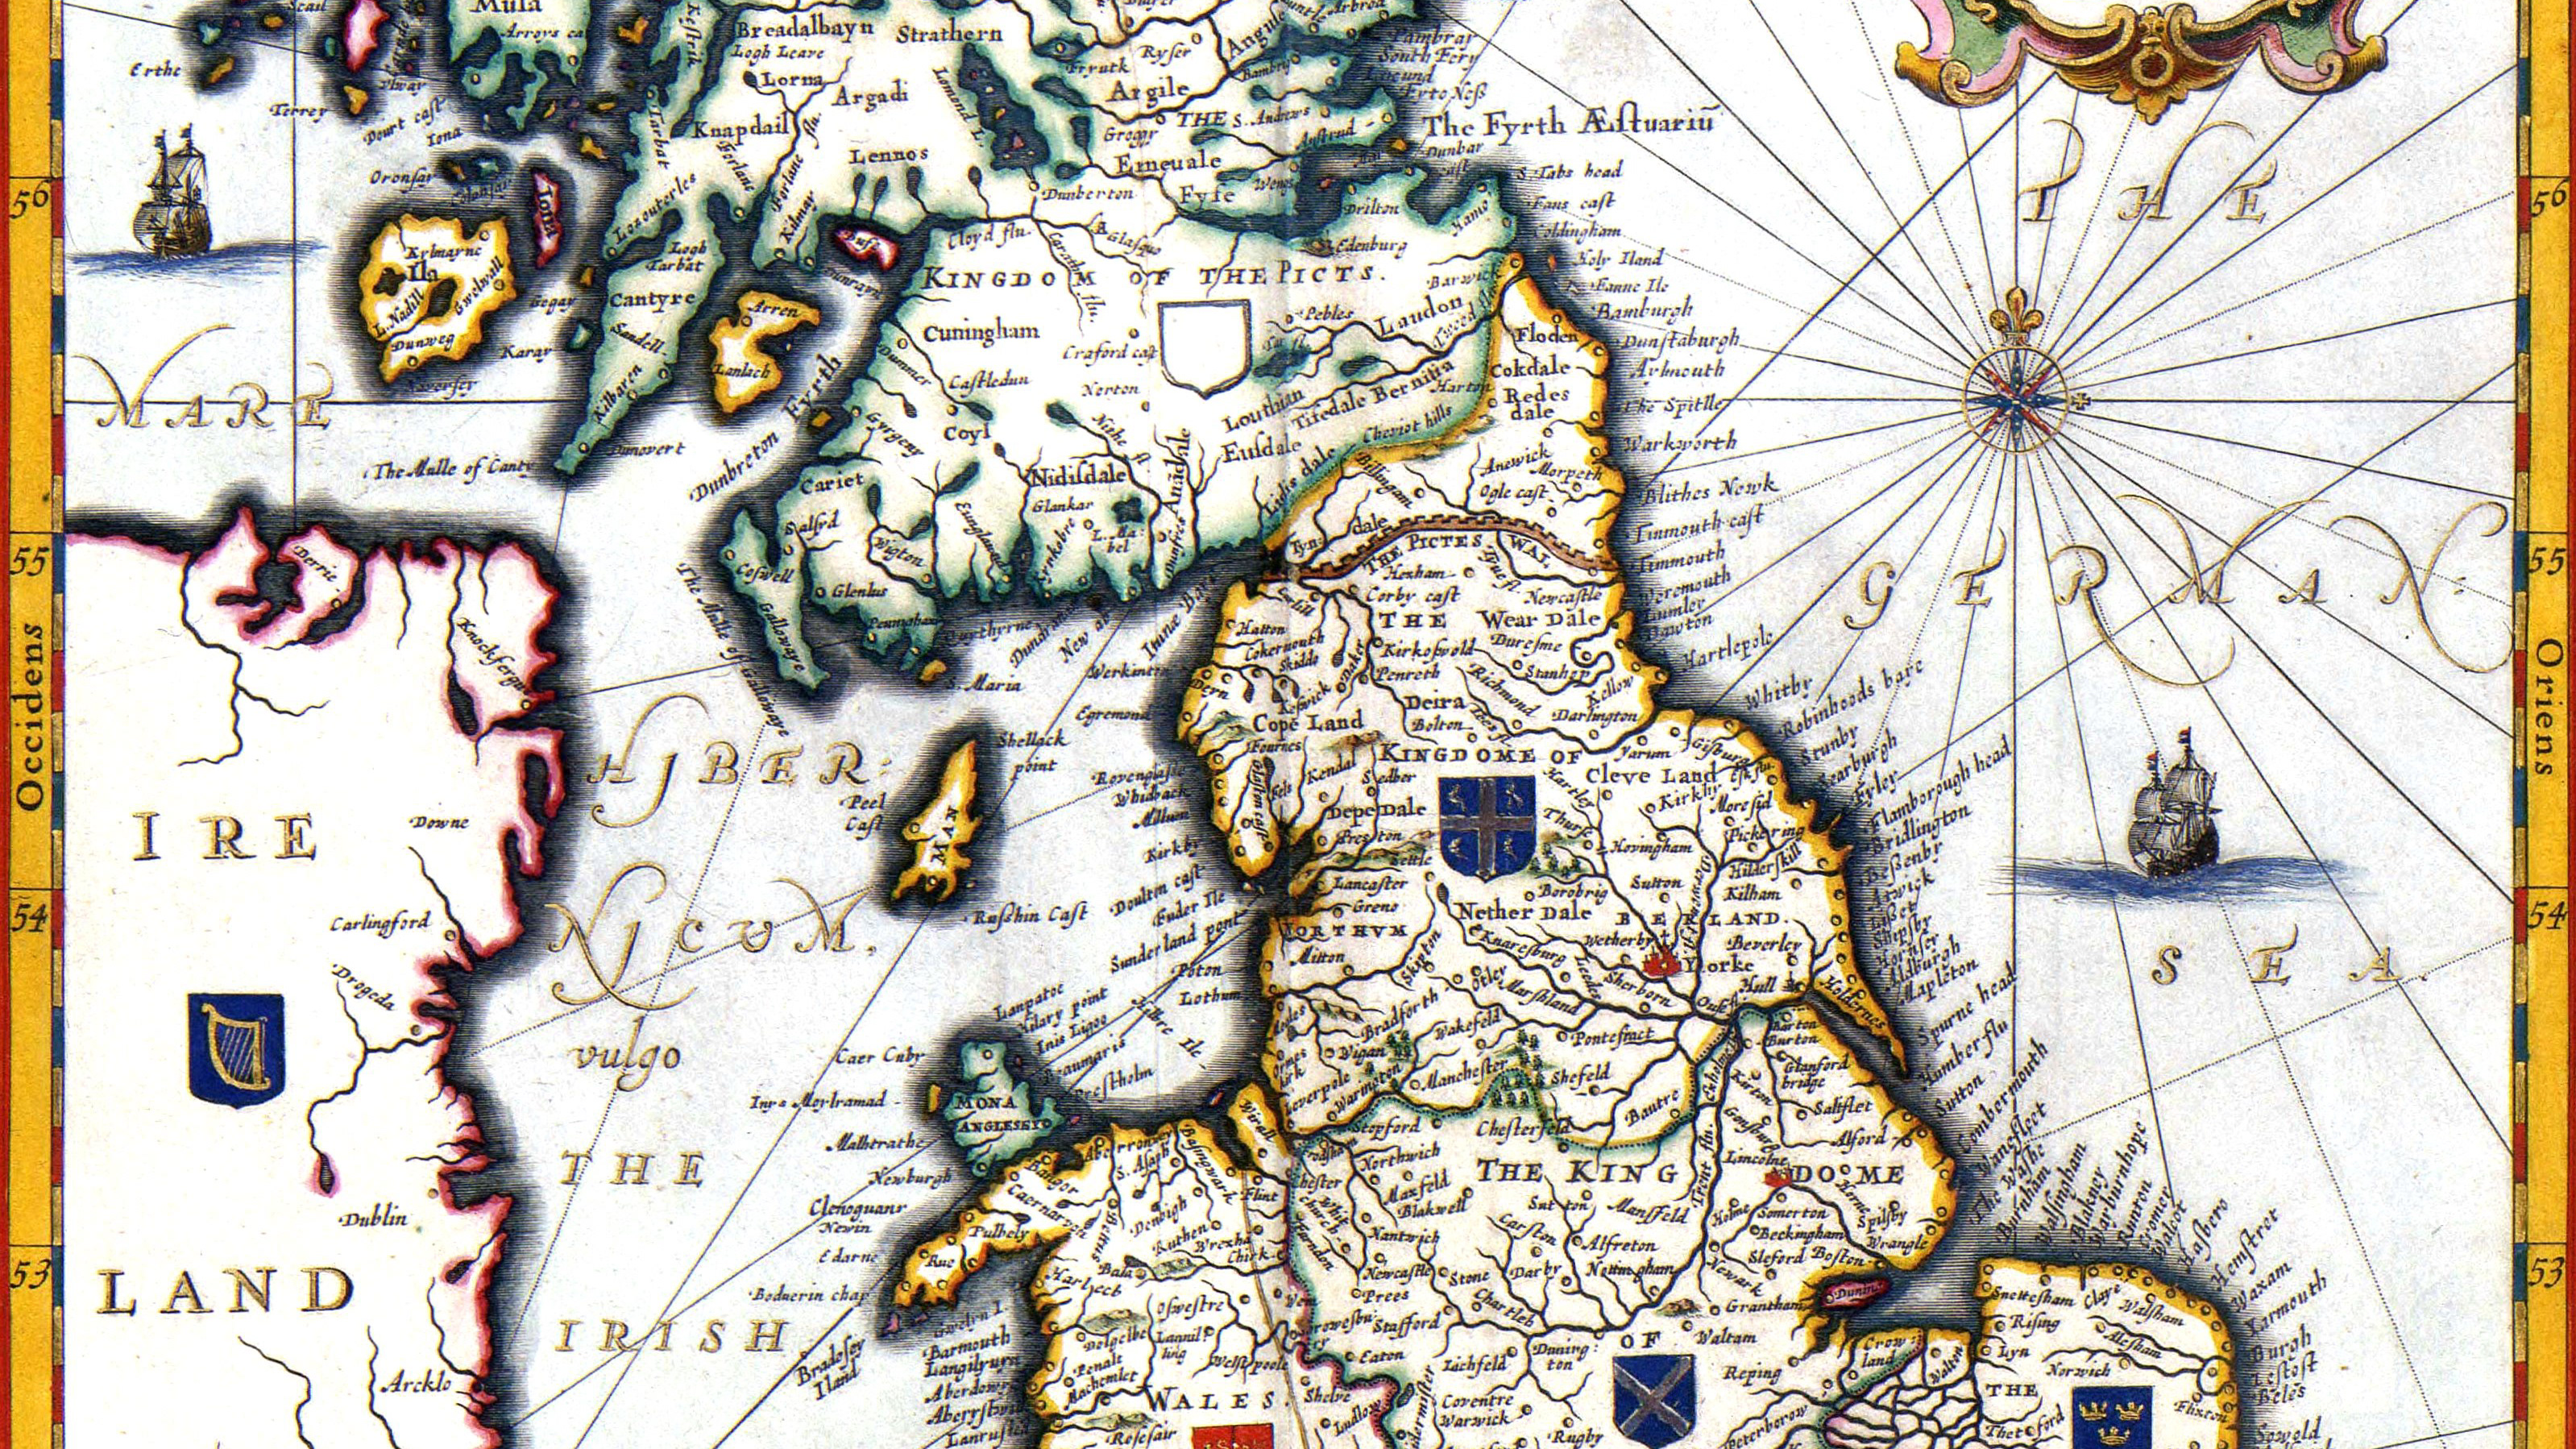
This project will try to locate Neolithic Burial Mounds, henges, and Round Barrows in the landscape of the United Kingdom. While by no means is this algorithm perfect, it does do a fairly well job at scanning and detecting sites, and with some improvements (which I detail below), this program can function very well for drone or aerial survey technologies.
Part 1
Step 1: Gathering Templates and the first Optimizable variable (Templates)
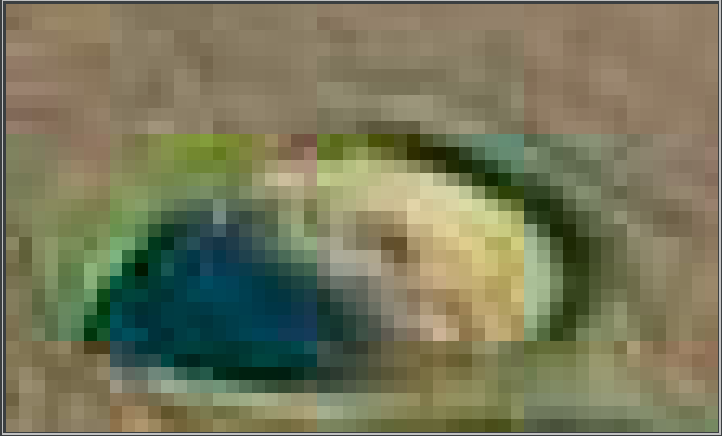
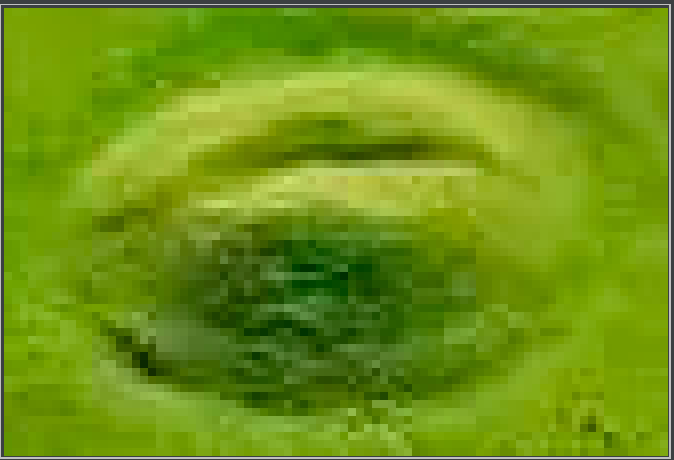


These are just a few of the of the templates that are used in the cross-correlation part of the algorithm. Notice that these are all different variations of the type of Neolithic round barrows and henges found in the united kingdom. Of course, the goal is to optimize the amount of actual sites being detected while limiting the number of false positives. one of the variables in this would be the number of templates used to scan during cross-correlation. Too few may mean that sites that may have drastically different features than the ones in the template may not be captured by the algorithm, but too many may be inefficient in the search phase of the algorithm.
Step 2: Cross Correlation and Convolution Functions
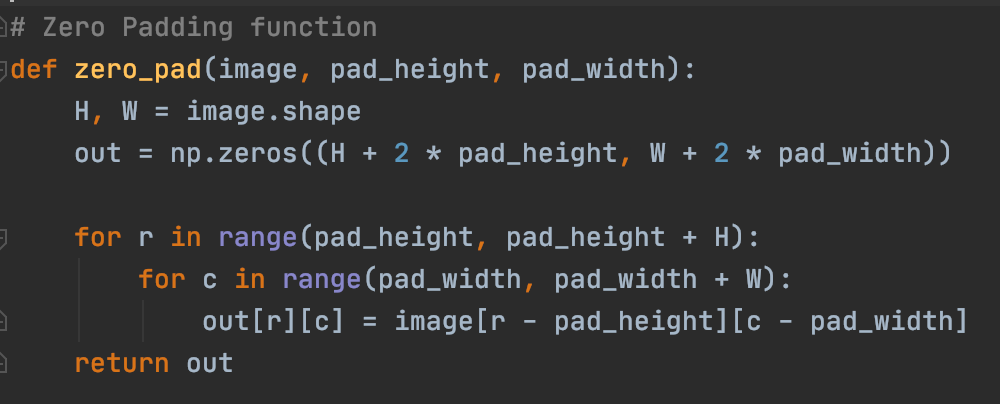
Before any cross-correlation, it is important to first zero-Pad for the specific template that is being used so that convolutions at the edge of an image can occur.
The conv-Fast function takes in an image and a template (kernel) and runs the convolution of the kernel over the image. Specifically, at each pixel, the algorithm convolves kernel and the kernel_size-equivalent region around that pixel. A regular convolution is used frequently in Gaussian Smoothing
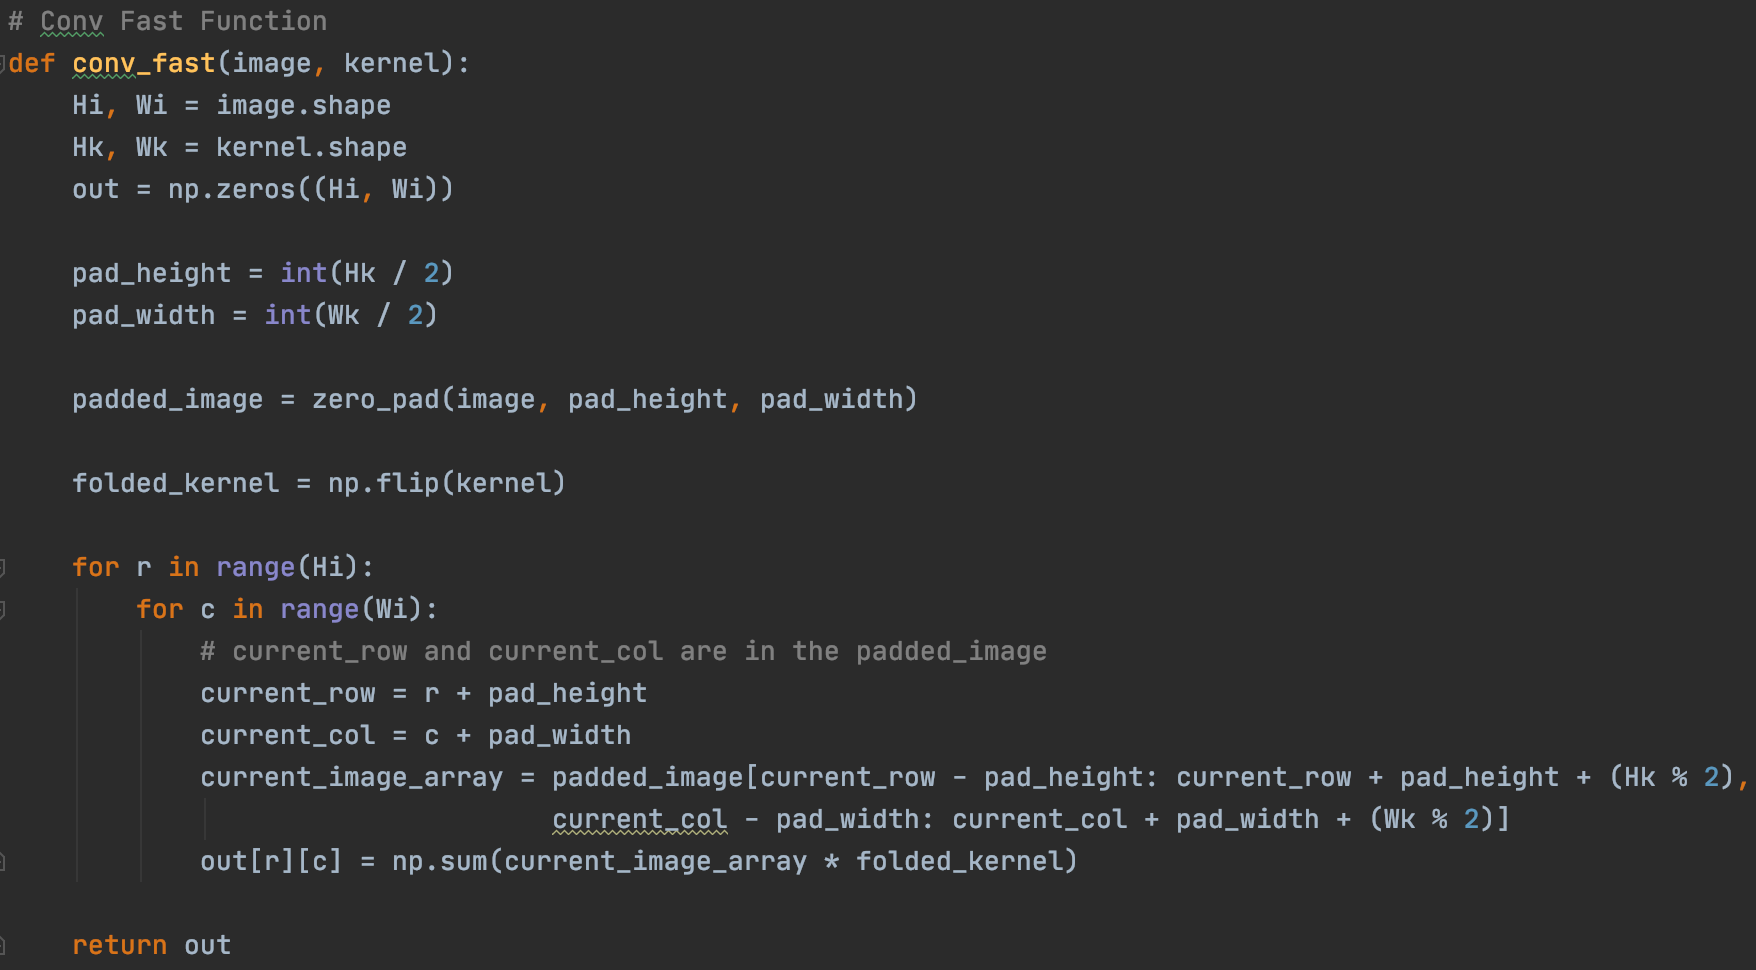
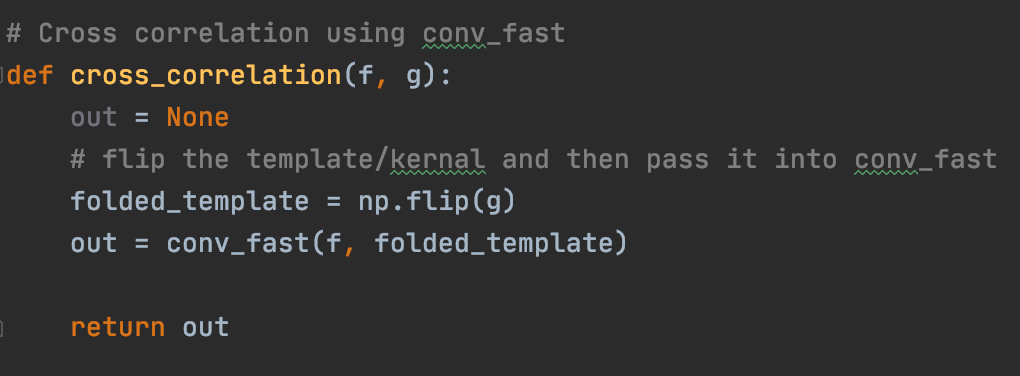
A convolution typically folds the kernel before performing the matrix operation at each pixel (this is what is done during smoothing operations). With cross correlation, we do not need to flip the kernel, and so in order to perform the operation we can simply pass in a flipped version of the kernel so that the in-function kernel flip operation will undo itself.
One method of cross correlation involves zero-meaning the pixel values before applying the convolution. this is so that really high or really low values don't skew the output value.
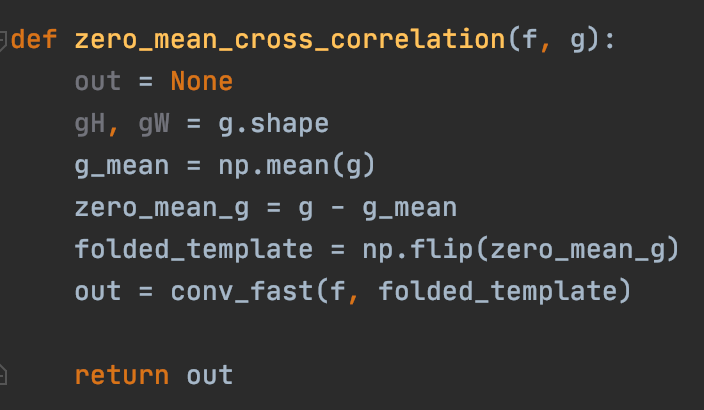

Using the normalized function for convolution as shown below, we conduct the normalized cross-correlation for each pixel. This is the cross-correlation method we will use in the Site detection algorithm.

Step 3: Setting Up Program and and the Second Optimizable Variable (Threshold Values)
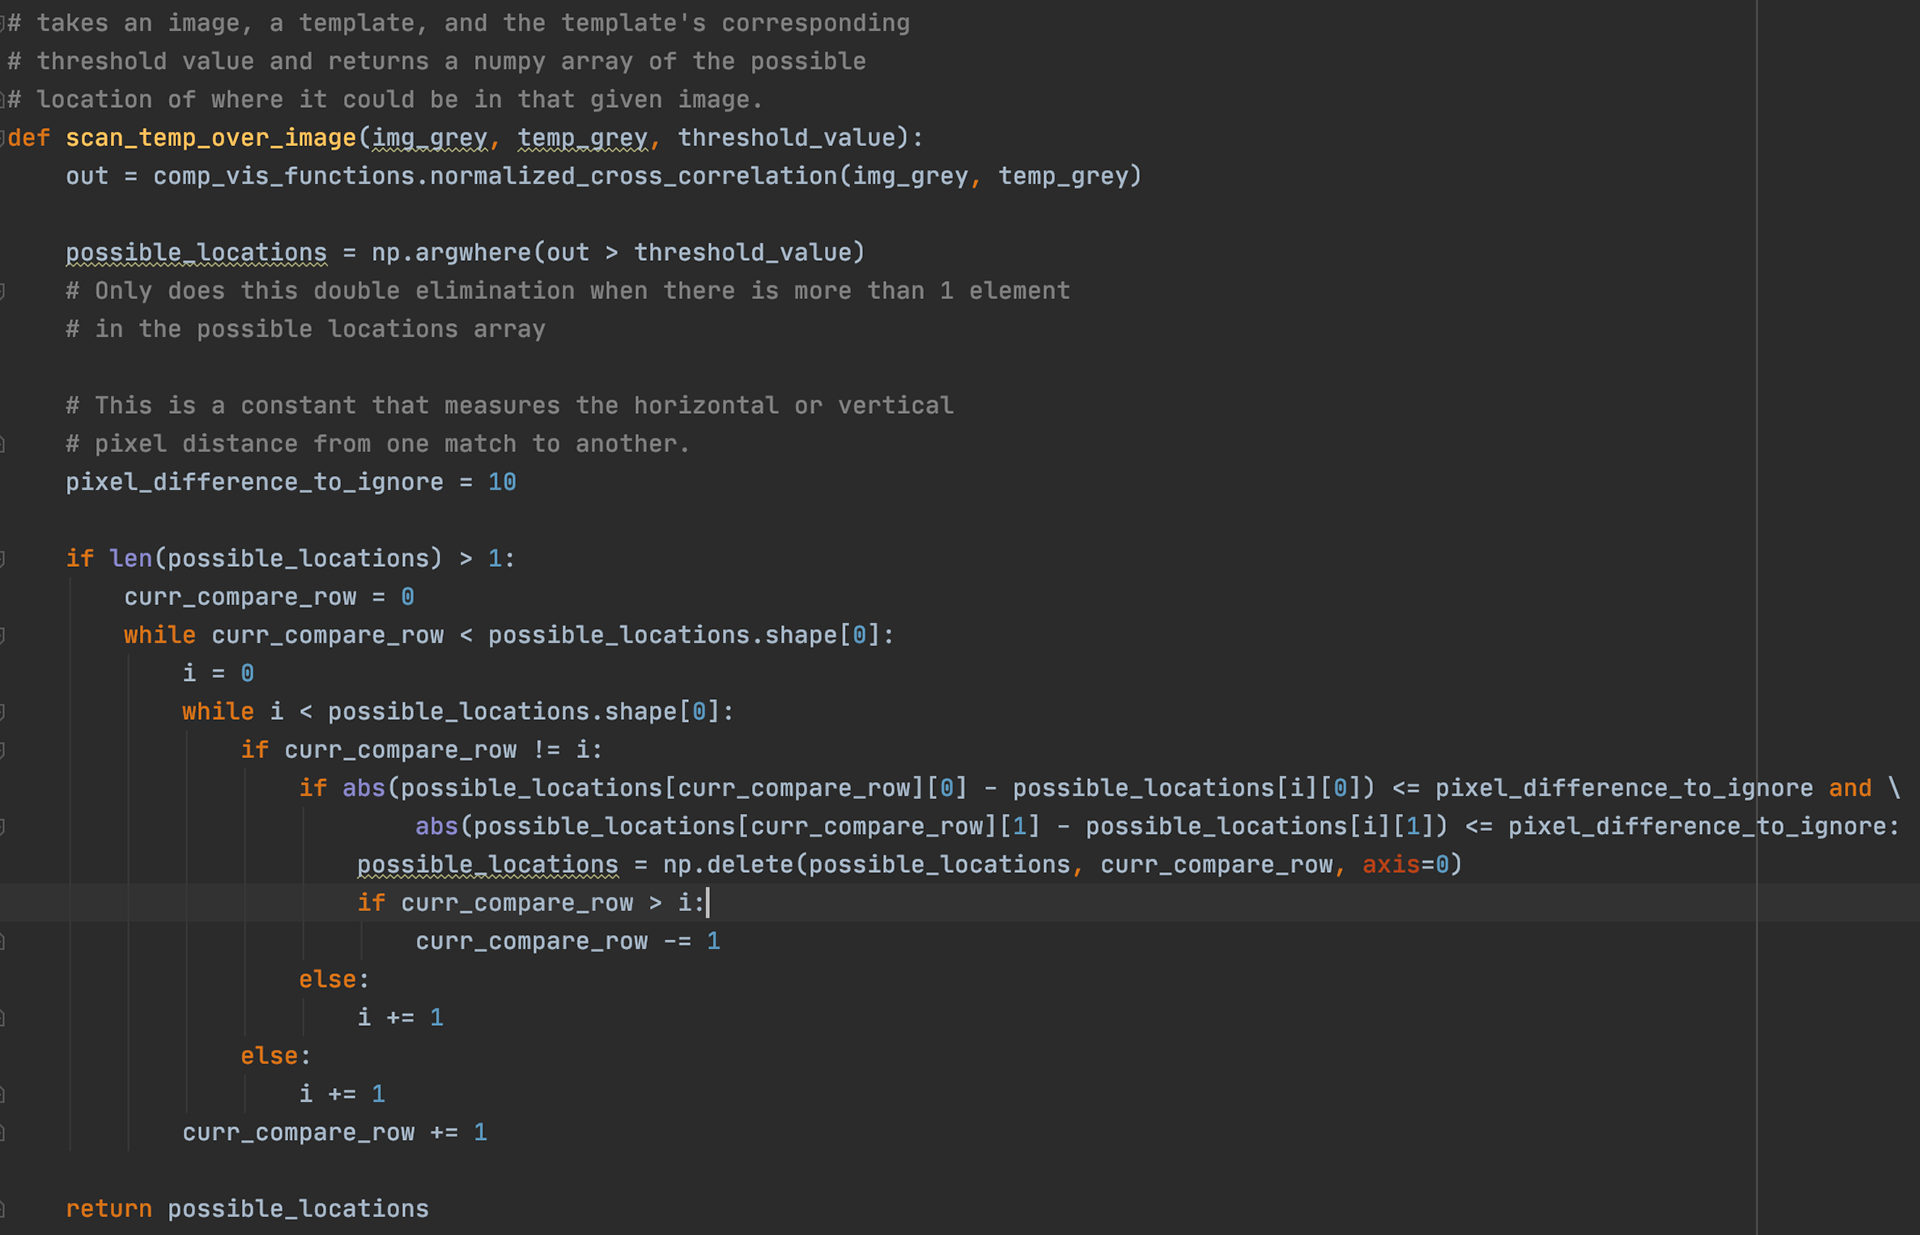
This function takes in an aerial image, a given template, and the corresponding threshold value for that template and returns an array of ordered pairs indicating the coordinates of the detected locations. Notice that an inner while loop iterates through those ordered pairs in order to delete potential duplicates. Duplicates occur because the cross-correlation of Adjacent pixels in the image are usually very similar, and since we want only 1 detection per site, if two or more pixels near each other both pass the threshold, only one will be counted as a detection since they are likely indicating the same site.
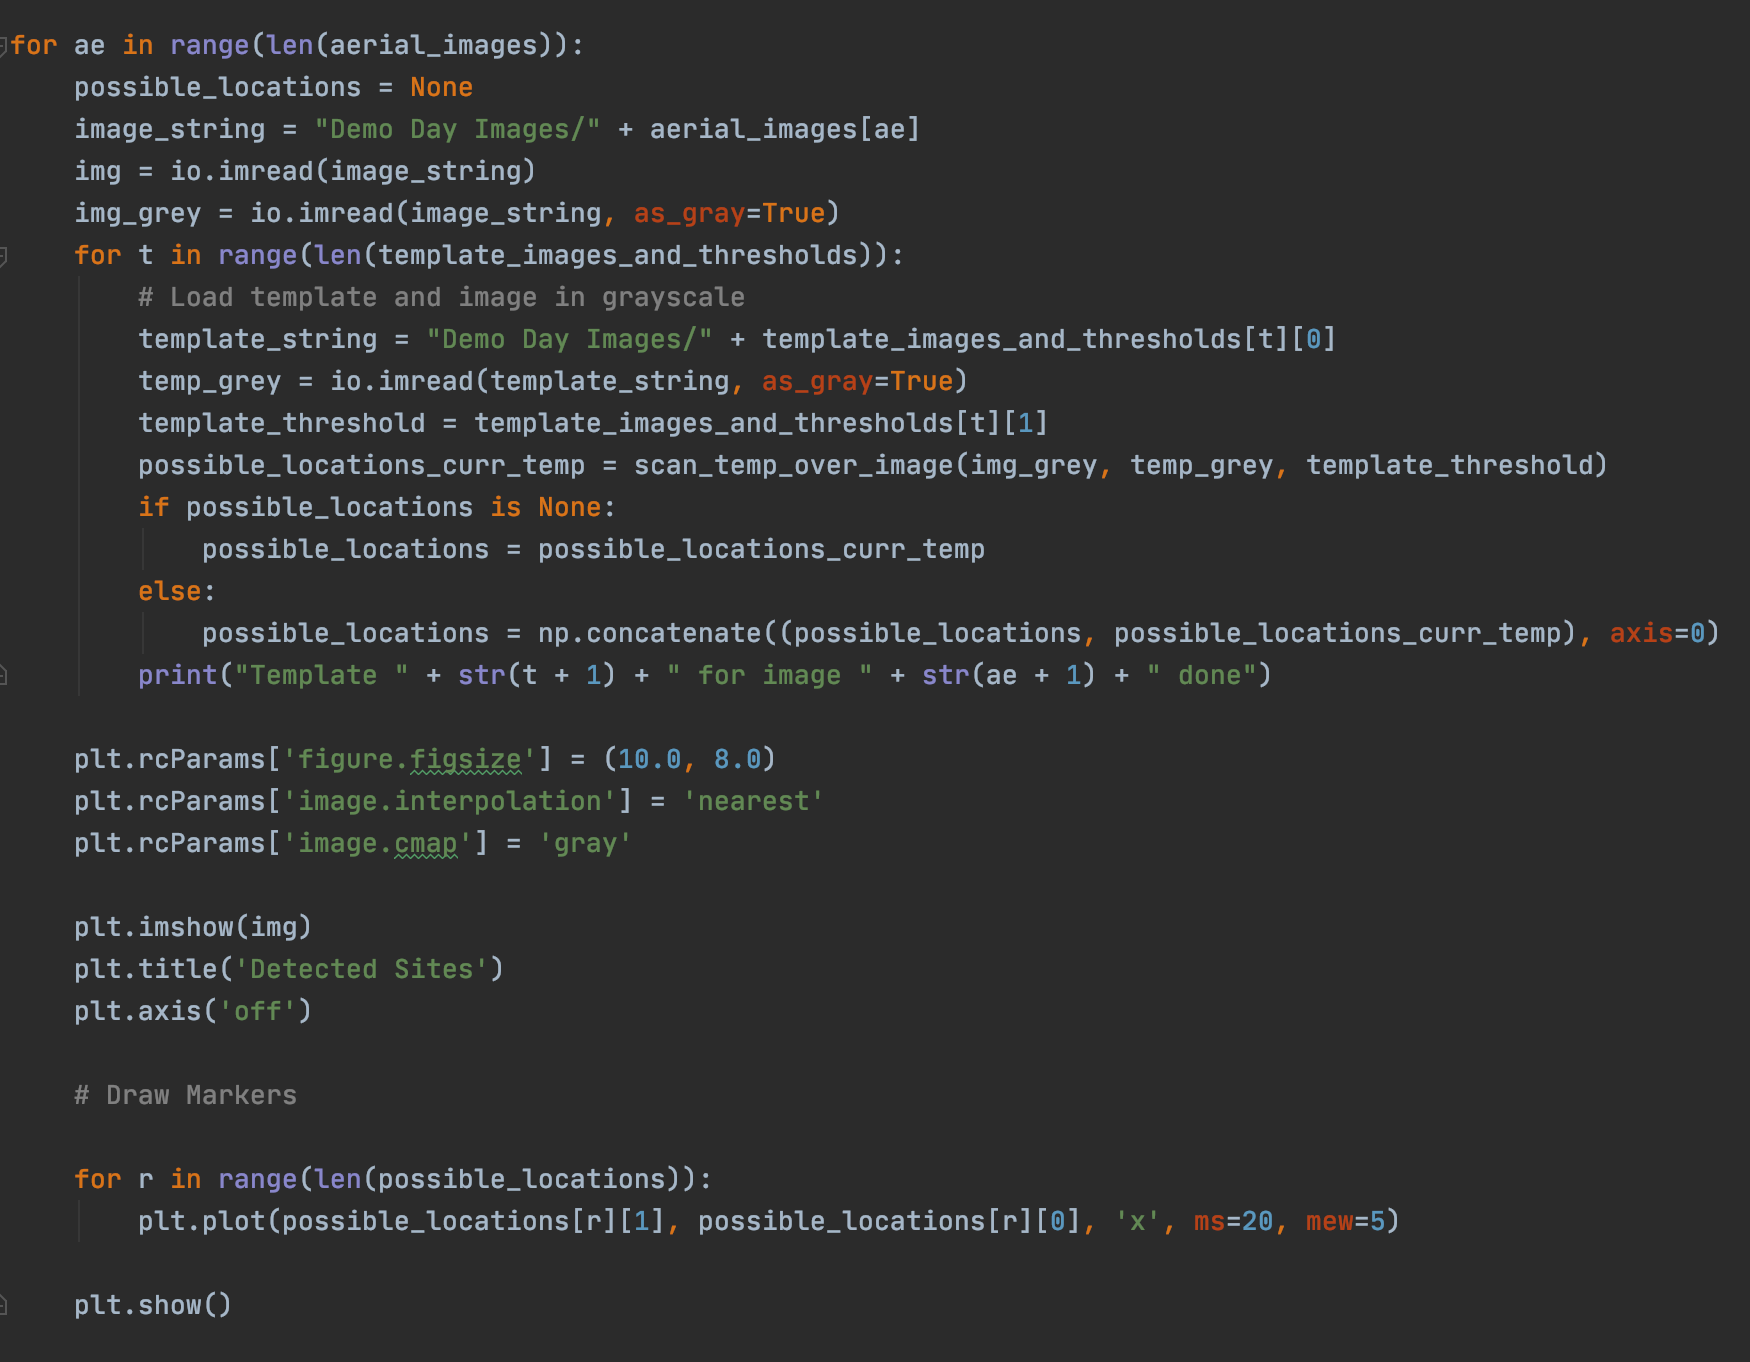
The main program loops through an n number of sample aerial images, and applies each of templates on each of the images. Specifically, every iteration of the inner for loop runs the scan_temp_over_image function (above), and tracks the key points, appending them to the list of detections for each image. Then for each aerial image, it depicts the locations where a detection was made by an X.
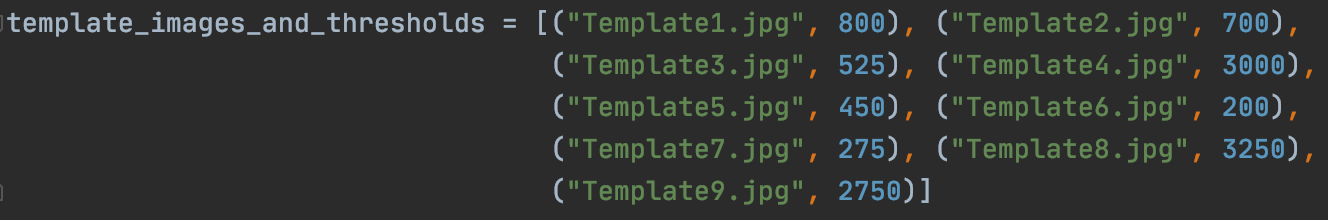
Ultimately, each template must have its own threshold that determines the minimum value that would correspond t0 a detection. Again, we are trying to optimize the number of correct detections while limiting the number of false positives, and so this requires a bit of trial and error on the test images, seeing which values work best. Here are some of the threshold values I came up with for each of the templates.
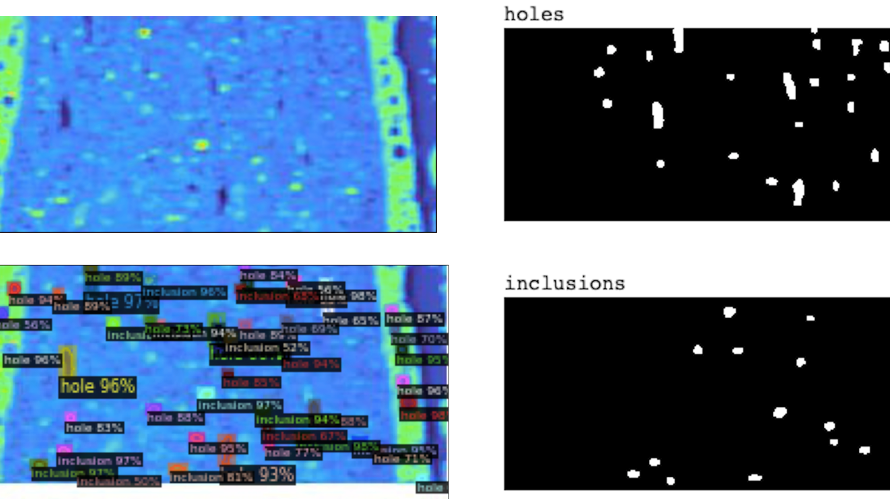
Sample Results Part 1
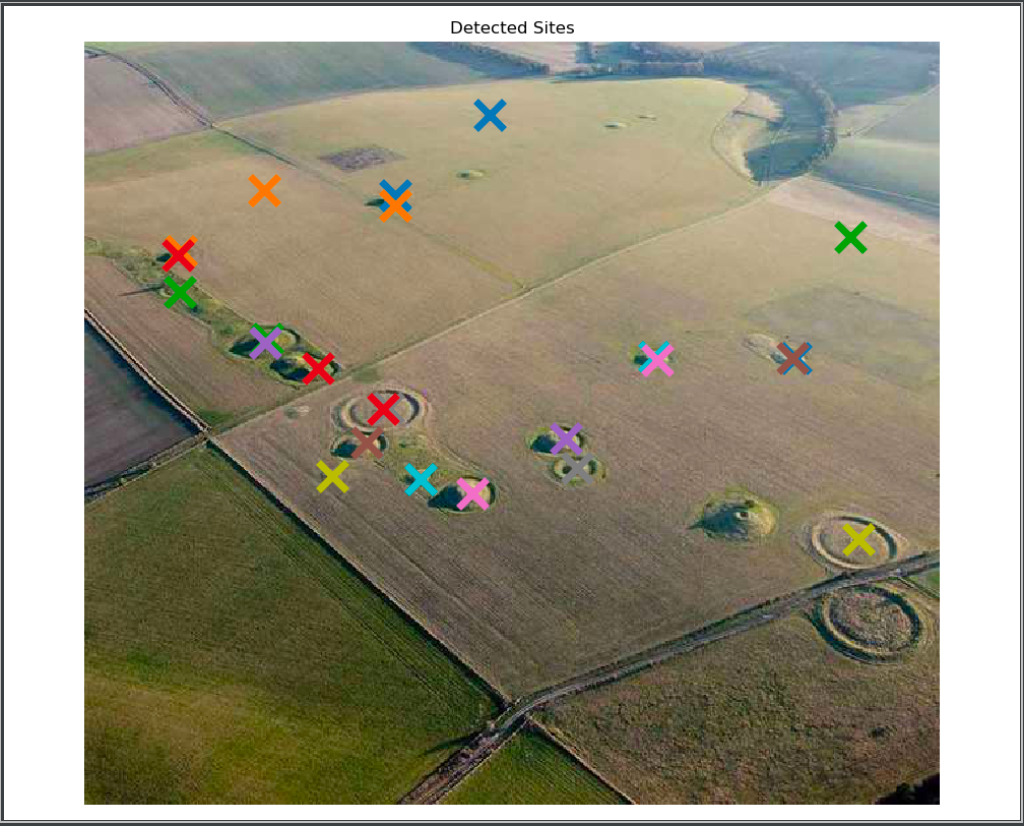
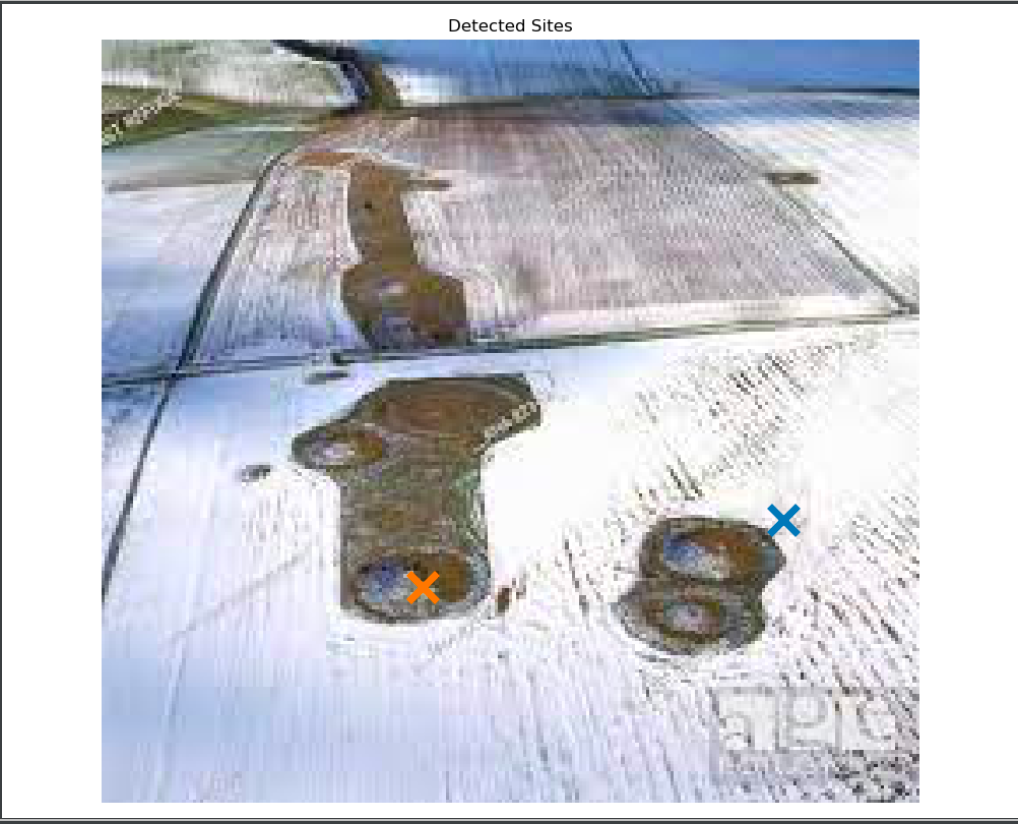
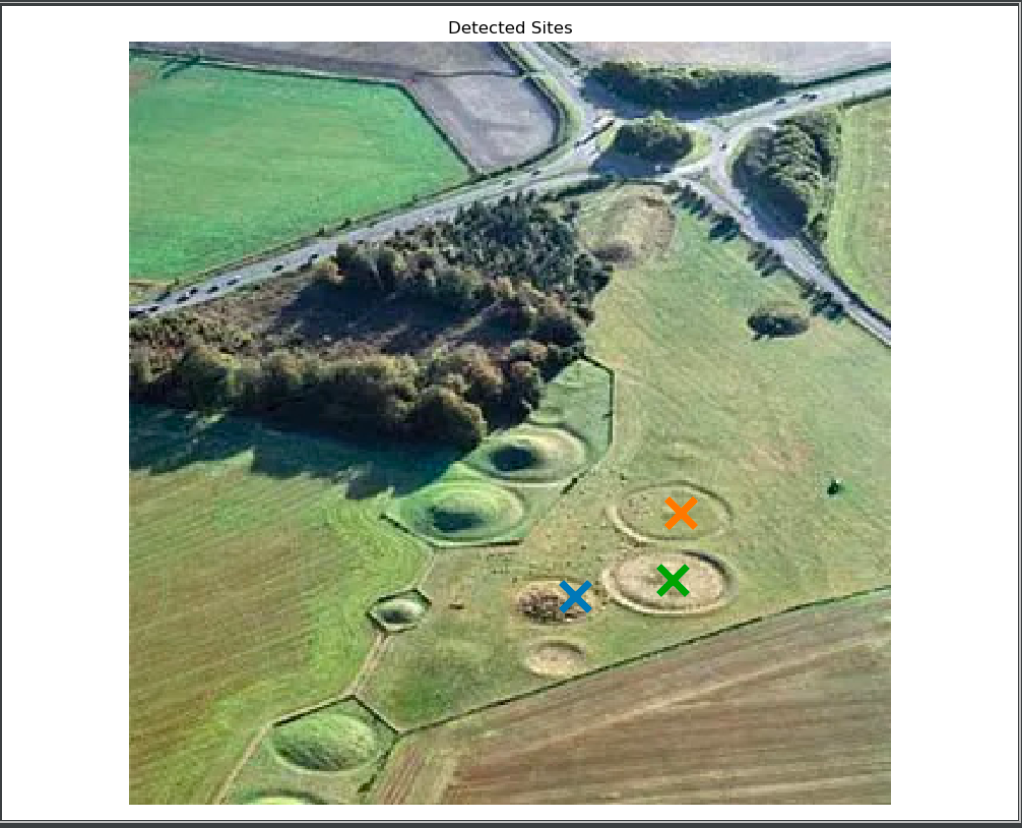

As you can see, although the algorithm is not perfect in detecting every single burial mound or henge, it does do a fairly well job. Cross-correlations conducted on the top left and bottom right images do well and capture a lot of sites because the mounds and henges in those aerial images are very similar to the ones in the template (or at the very least have the same shape). However, you can see, especially in the top right and bottom left images that some of the mounds do not get picked up. This is likely because these mounds are more oddly shaped than the more general ones we used as templates (see above). Hence, the algorithm is not able to capture certain mounds in those images.
Of course, the robustness of the program can be improved by adding more templates, in this case, but it can also be achieved by altering threshold values, as discussed later under the "improvements" section.
Part 2
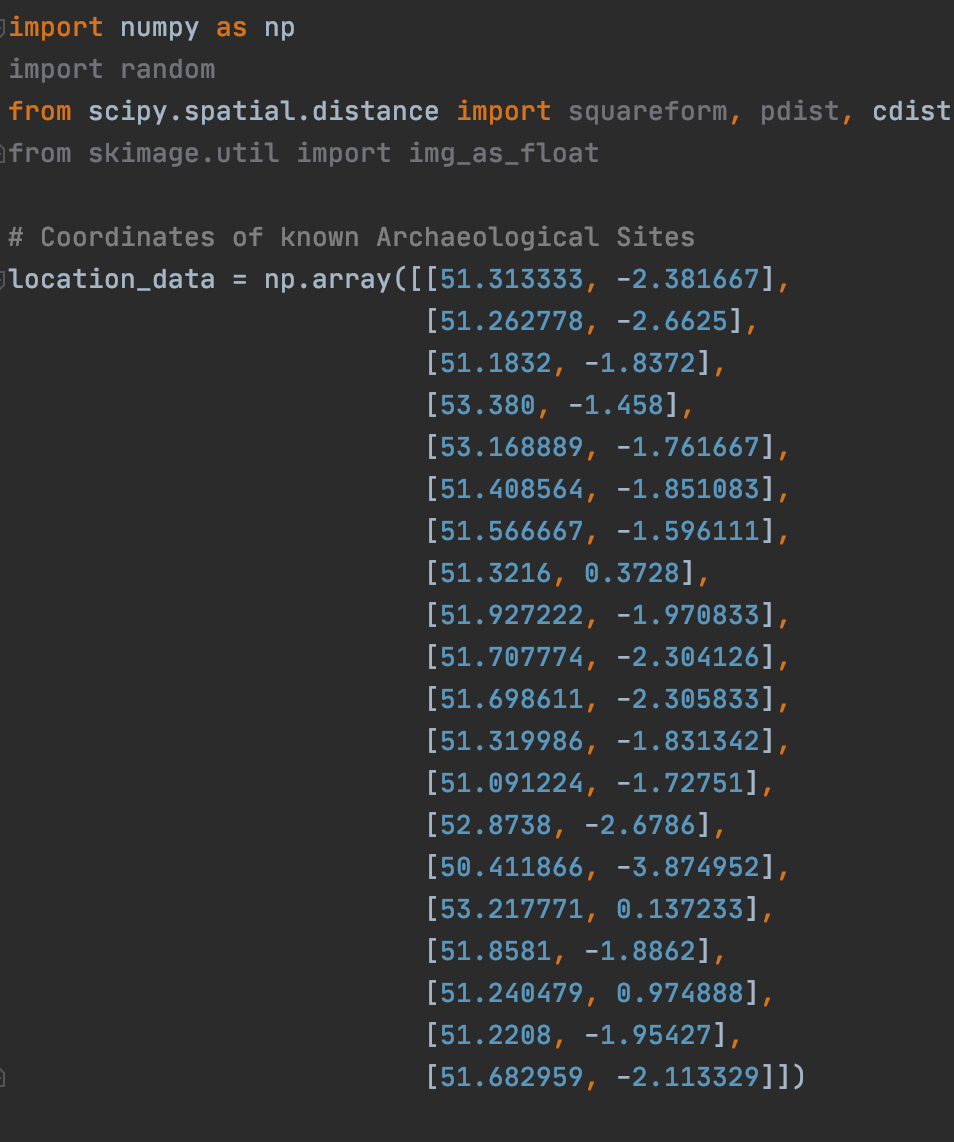
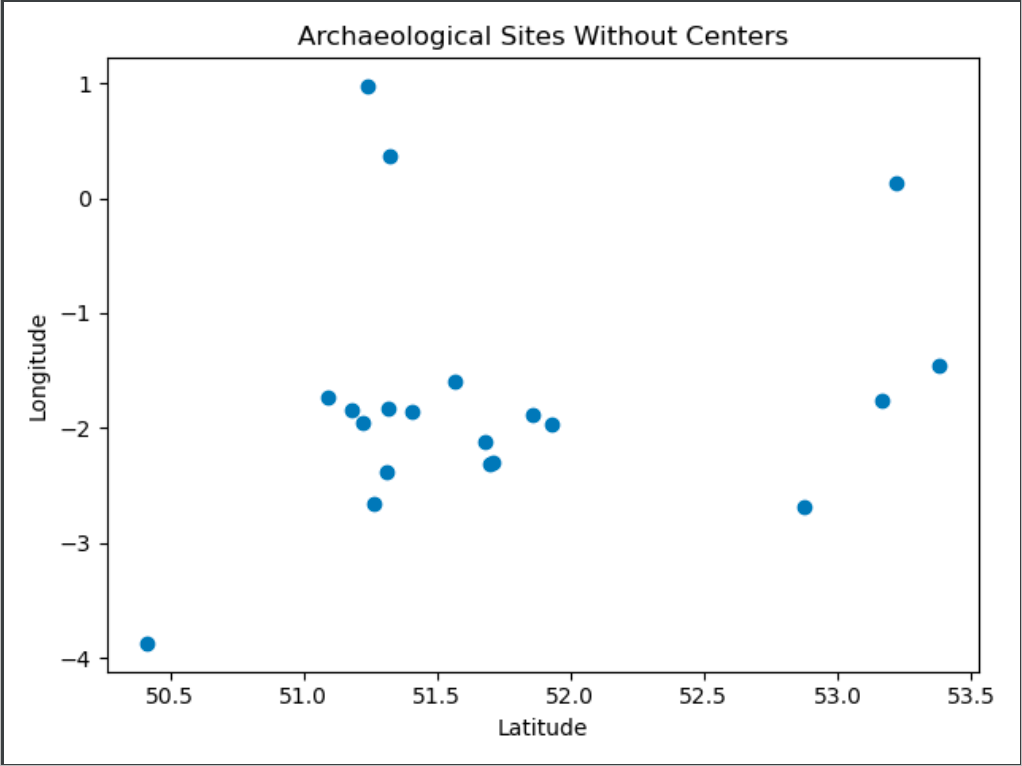
These are sample latitude and longitude coordinates of 20 known archaeological sites in the United Kingdom. We will be performing the k-means clustering algorithm on them to find 4 cluster centers. these centers can allow us to estimate locations where archaeological sites are likely to be located (or at least near these sites).
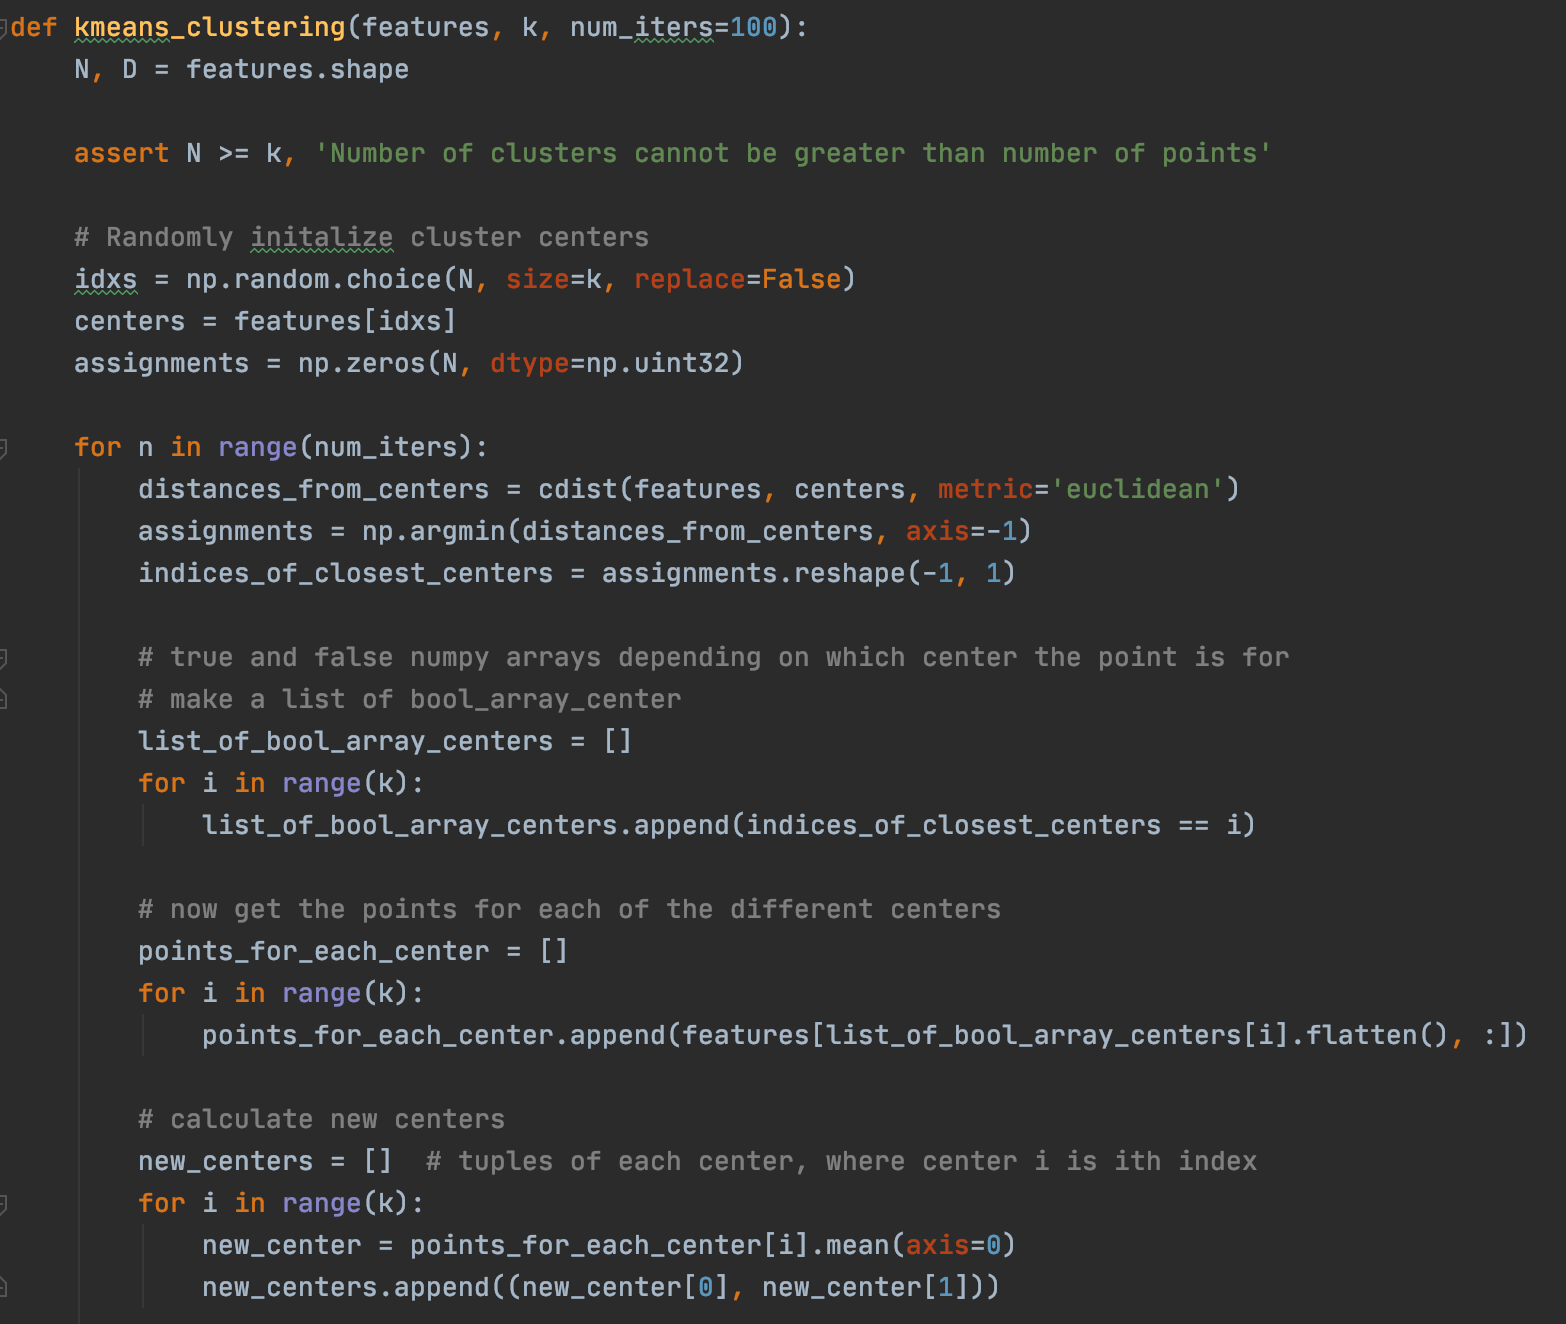
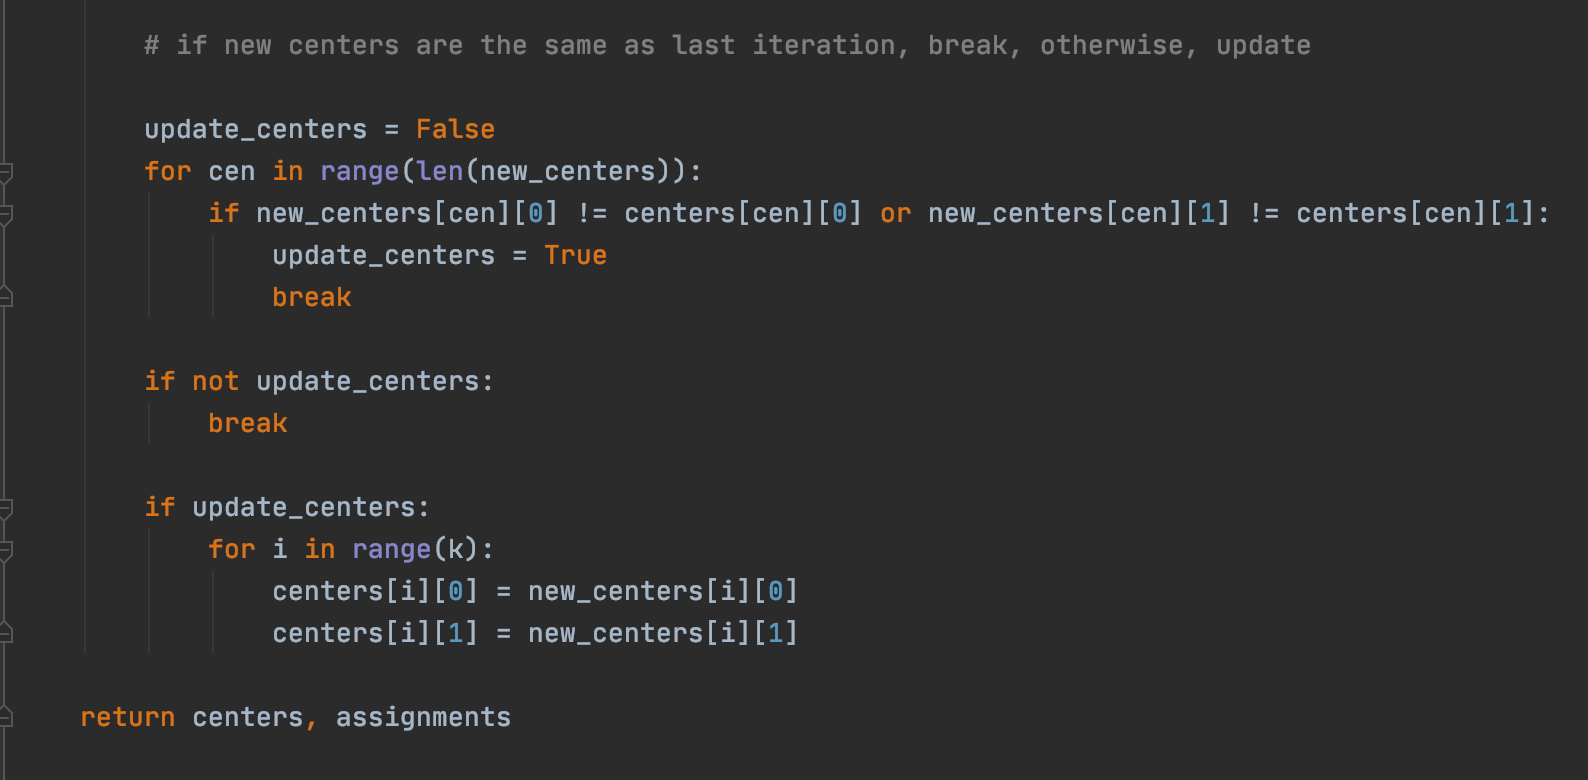
The following is the k-means clustering algorithm which runs until either 100 iterations have occurred or the center locations have stopped changing. The function returns the locations of each of the centers, as well as the assignments, which is the center that each archaeological site is associated with.
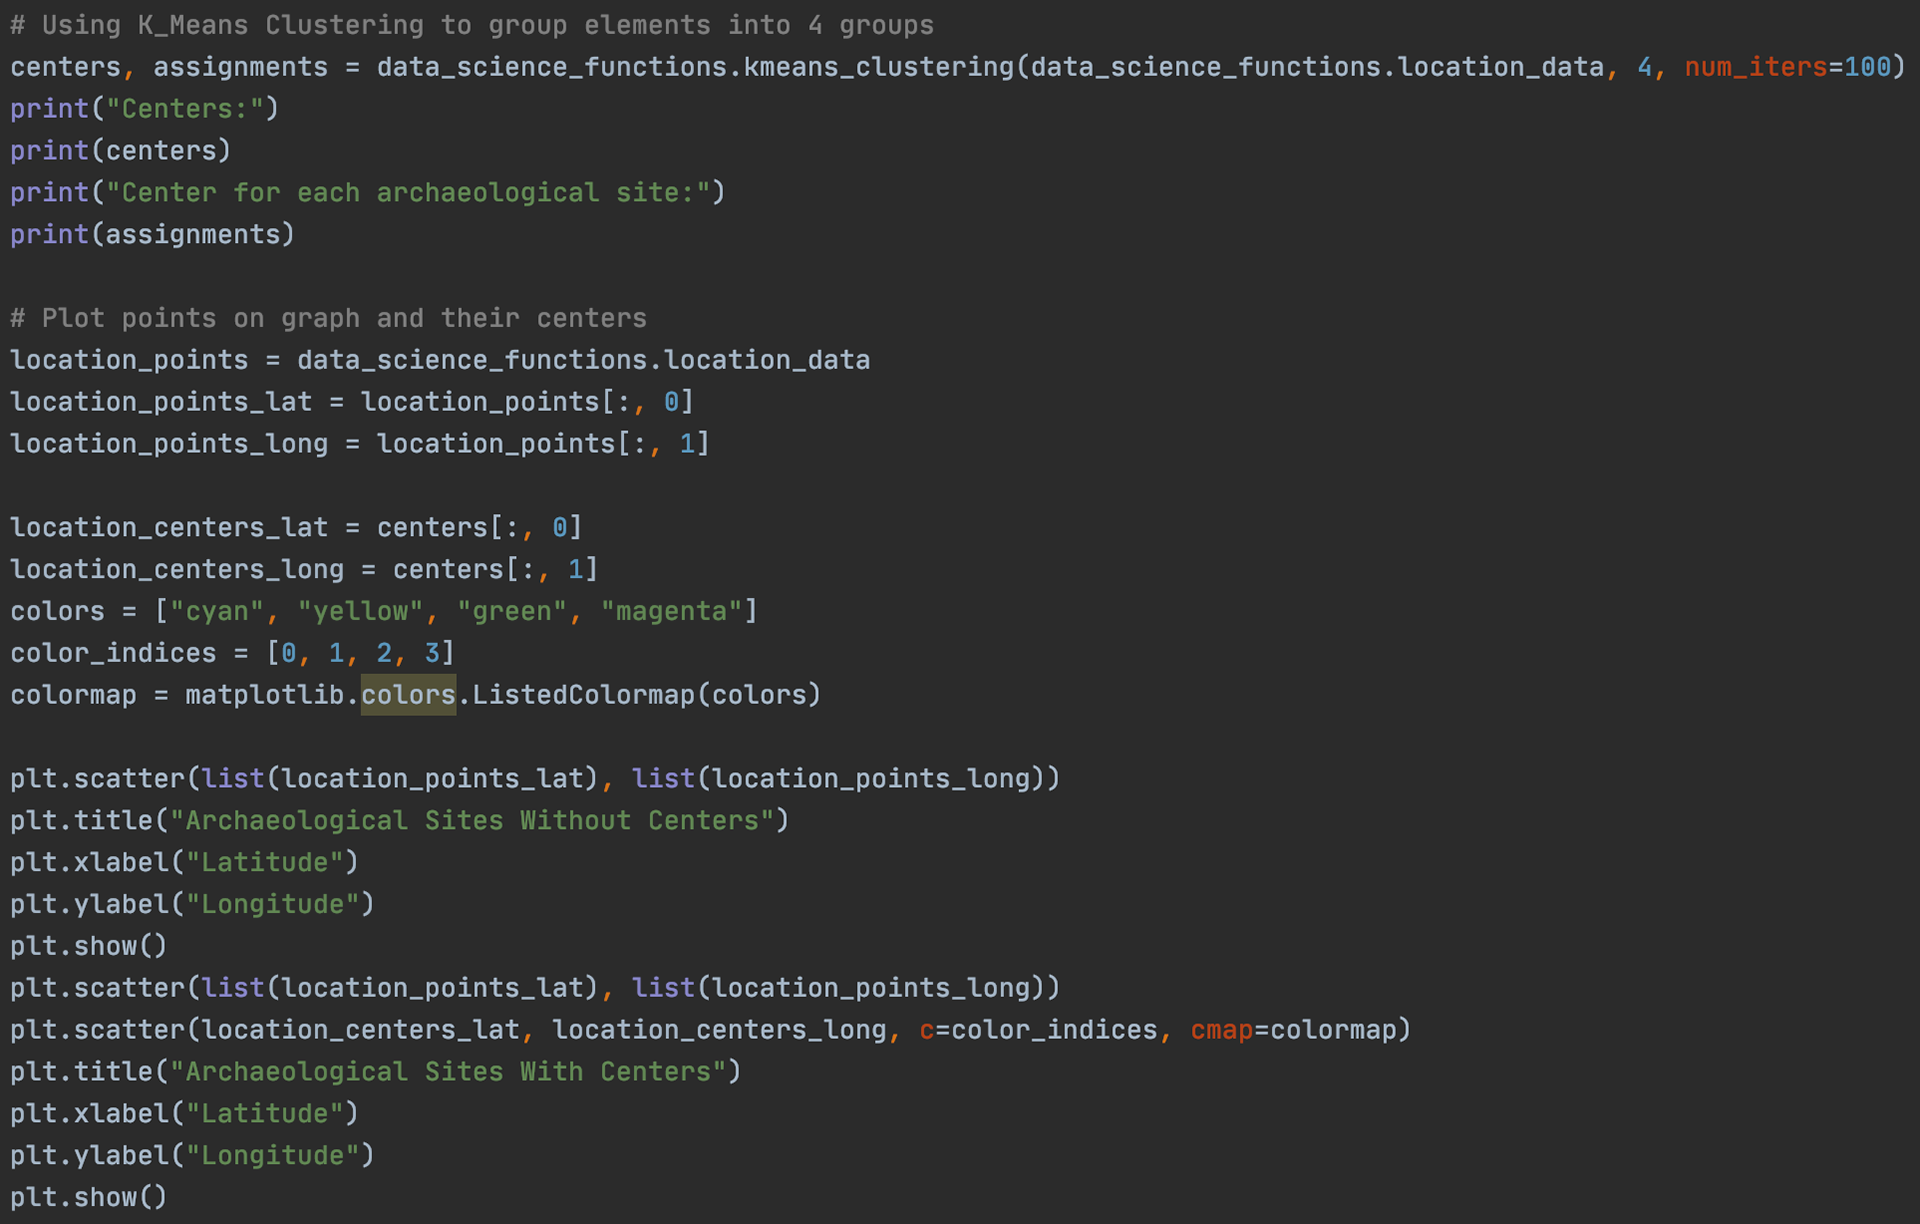
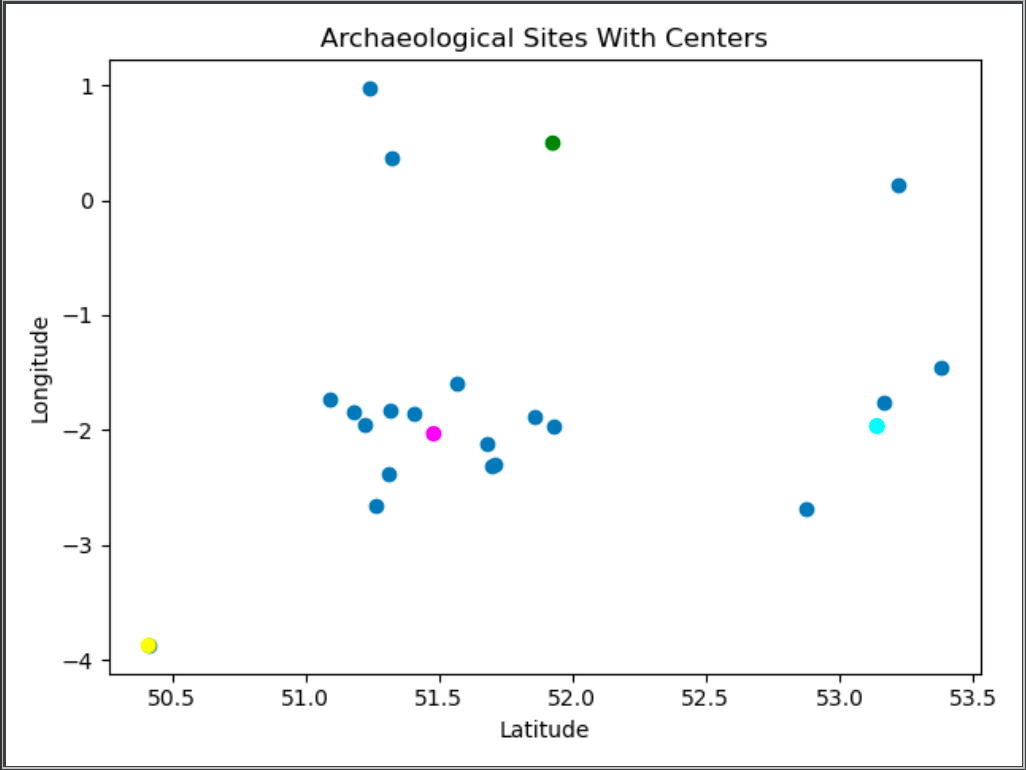
The code on the right simply calls the k-Means clustering function above and uses Matplotlib plotting functions to plot the site locations as well as the calculated cluster centers on a plot. Below are the results.
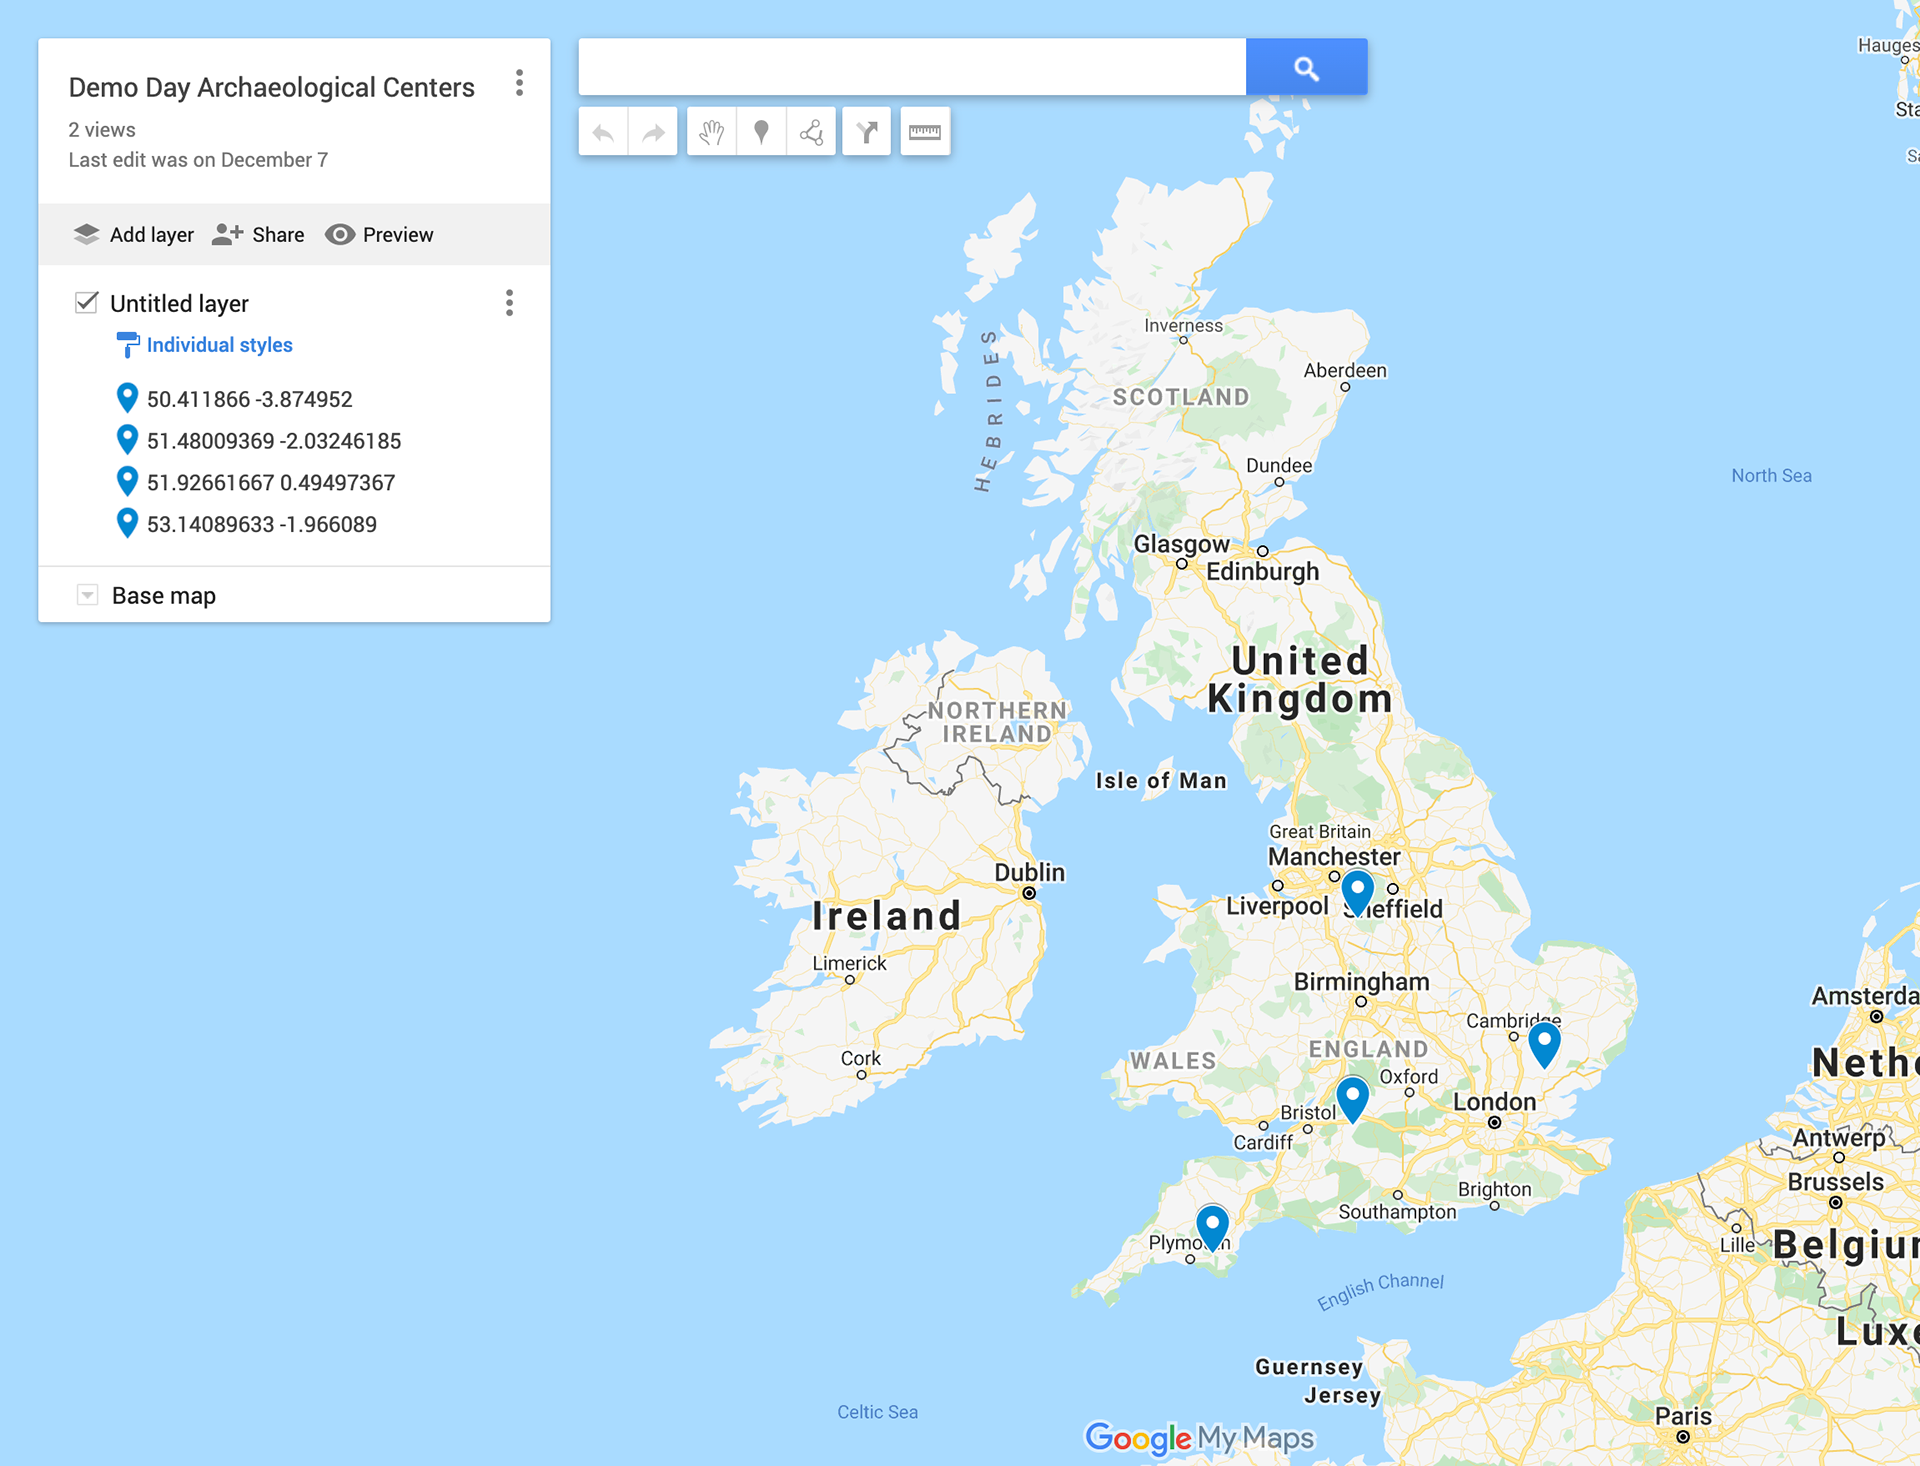
But it is probably easier to see the cluster results on an actual map. The Blue Markers indicate a cluster center. The results show that from the 20 sample sites, approximate centers with high probabilities to contain new archaeological sites would be located along the southwest coastline near plymouth, approximately halfway between bristol and oxford, in north England near sheffield, and in the rural london outskirts southeast of cambridge.
Putting it all together and Improvements
Although the two parts of this project seem distinct, one can see how we can connect the two programs into a very effective tool for archaeologists and land surveyors alike. Basically, one can use the cross-correlation technique to find archaeological sites over a particular region or geographical boundary, and then using the location of those detected sites, use the k-Means clustering algorithm to estimate centers and predict where other archaeological sites may be. Then, aerial surveys can be taken over those regions specified by the cluster centers, trying to locate more new sites using the cross-correlation program. Then, k-means clustering can be applied once again, and the cycle can repeat to smaller and smaller regions. Thus, it is clear this methodology for locating and finding Archaeological sites (or at the smaller scale, archaeological artifacts or features within sites) can be applied in a wide range of contexts and scales within aerial surveys.
One improvement to the cross-correlation algorithm would be in Applying the duplication key point deletion after all templates have been run on the image, instead of inside the Scan_Temp_Over_Image function. the current way still leaves the possibility that the same archaeological site can trigger a detection more than once, in the case that two or more templates trigger a detection in the same spot on the image during cross-correlation.
another improvement to the cross-correlation program would be to add an upper bound to each of the threshold values for each template, instead of just having a lower bound. Having a more specific range will eliminate more false positives from the detection list output.
Of course, the wide variability in the features of neolithic barrows and henges imply that more templates be used in the algorithm to account for the many different variations of the site features.
Lastly, the cluster center algorithm obviously becomes more and more accurate when more site coordinates are added to the total data. We only used 20, but there are thousands of barrows, earthwork enclosures, and henges throughout the united kingdom (and hundreds of thousands of archaeological sites, for that matter). Unfortunately, for this project, i did not have access to all these sites, but with this data a k-means algorithm can prove to be more useful.
A Note from Umar
I avoid simply placing my computer science projects on GitHub. I personally believe that GitHub doesn't do as well of a job as showcasing the process of constructing a computer science project as a portfolio would. Therefore, I aim to display all my personal and internship projects on this site, showing not only my code but also my thought process in constructing the program.