This page details my work for Stanford's SLAC National Accelerator Laboratory During my Summer 2022 Internship. I was a computer Vision and Data Science Intern working on developing autonomous programs that could detect and segment key regions of interest (ROI) from ceramic cross sections.
DataSet
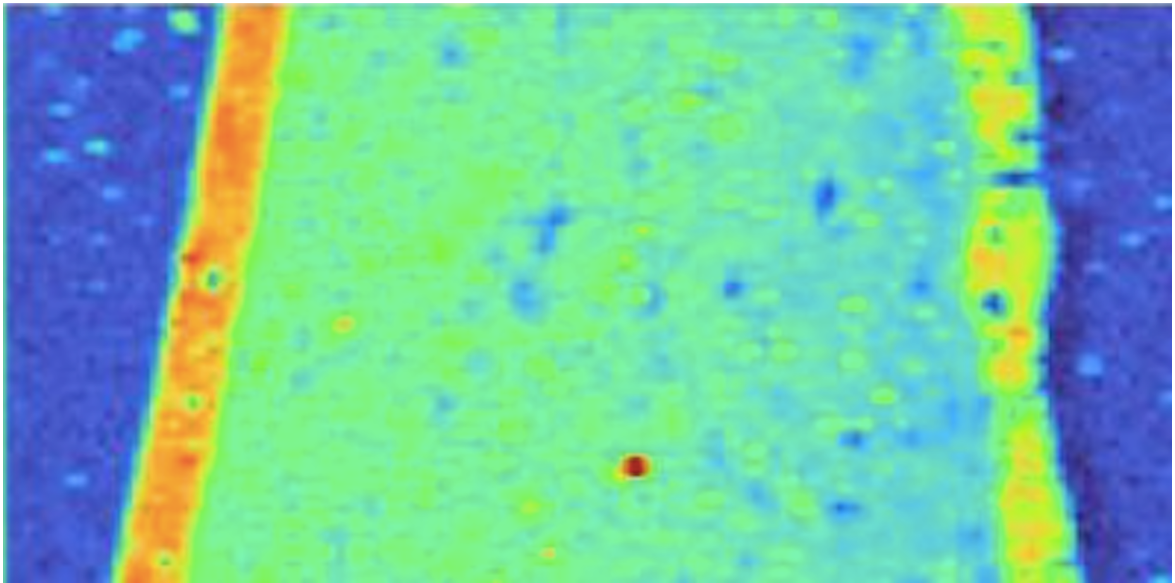
While the raw dataset were a series of XRF files which contained various values for the intensities of different element channels (approximately 20) within the various regions of the scan, the scans that I was looking to perform CV techniques upon were individual element channels. A lot of my focus this summer was on the Manganese and Calcium Channels since they were able to project ROI the best in the image scan. a Detection model for scans of the Manganese or Calcium channels could likely be extrapolated to other channels, with minor tweaks in the training data images.

TEACHING A MODEL to distinguish between AN INCLUSION OR A HOLE
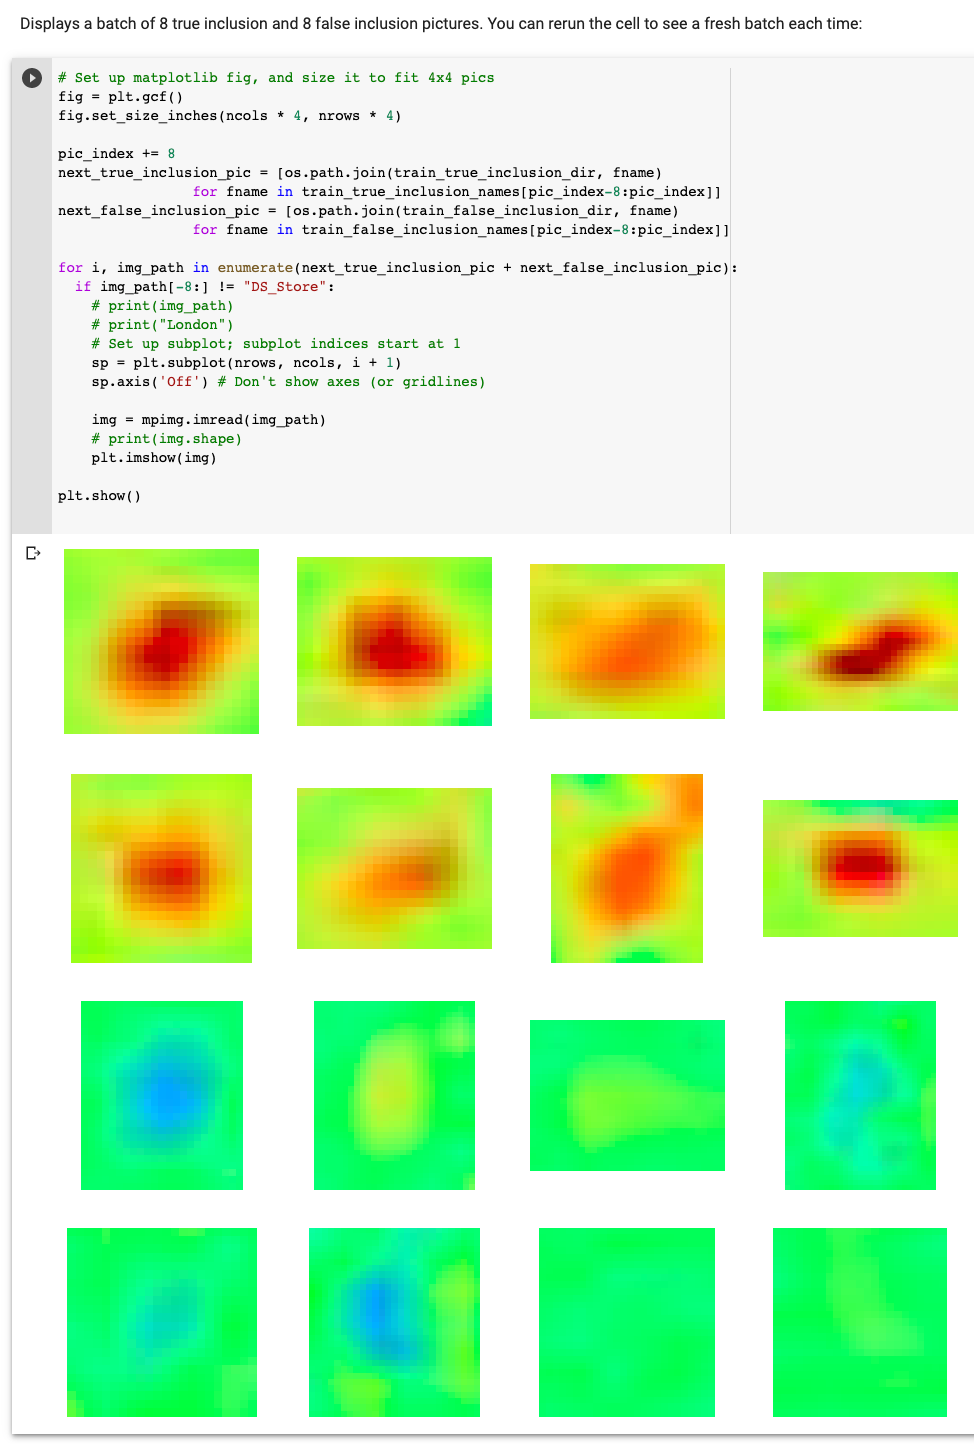
Our first goal was in trying to see if a model can distinguish between an "inclusion" (one of the main types Regions of interests we were interested in capturing) and a False positive of an inclusion, which we call a "hole". My first approach in trying to develop this detection model was in first constructing one that could identify whether a certain region within a cross-section scan was an "inclusion" or a "hole". I used a binary classification Model to test this out, developing a training set with images of both inclusions and holes, labeled accordingly. IN the notebook output on the left, the top 8 images represent sample images that are labeled as "inclusions", and the bottom 8 images represent sample Images that are labeled as "Not Inclusions".
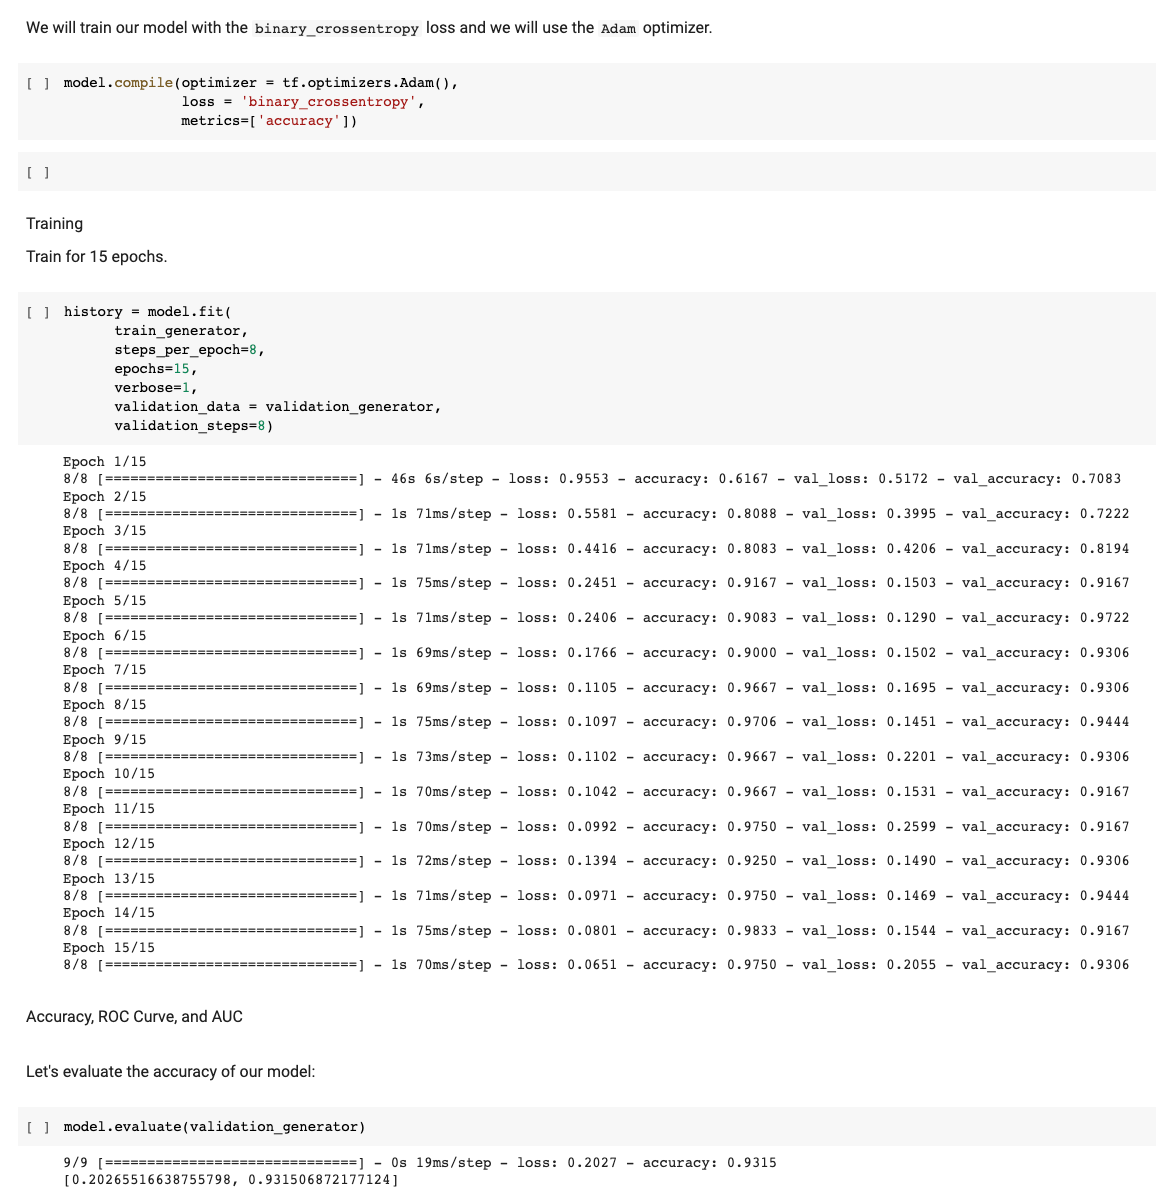
After training on a small sample dataset, we received an accuracy on our test set of approximately 93%. While this is an excellent accuracy for the task of determining whether a given section of a cross section scan is an Inclusion or a Hole, this simple binary identifier is not exactly what we need. We need our model to not just identify such regions as holes or inclusions, but be able to do so when given the entire cross section. Furthermore, we also want to segment, or outline these regions of interest so that we are able to conduct further material analysis on those specific regions. These regions are identifiable by the pixels within the image scan, and so having a System that also labels each pixel would also be useful.
Using Edge Detection to Outline Regions of Interest
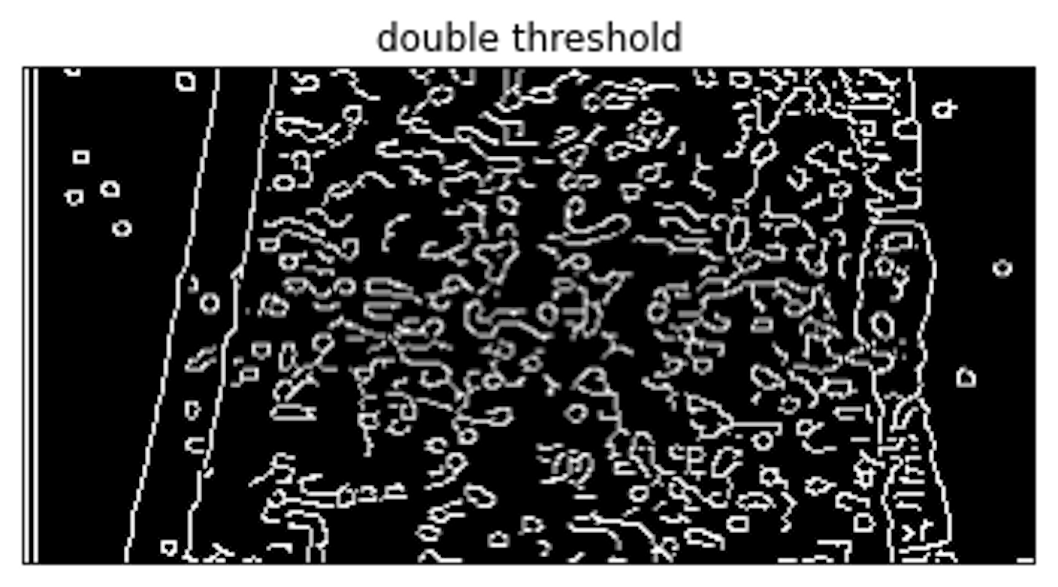
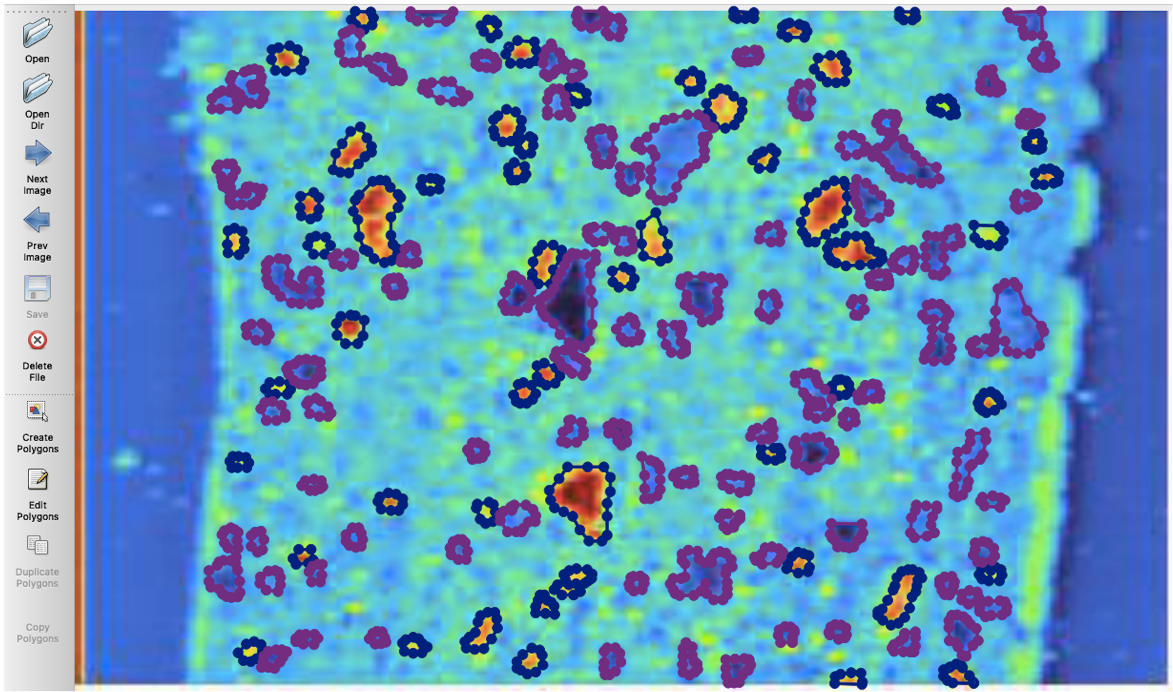
Detected Edges in Liquor Bottle Ceramic cross section, using canny edge detection model with double thresholding. While many of the "inclusions" and "Holes" are outlined. One of the issues with this method is that a lot noise is also captured. You see that while many of the outlines in the gradient image (left) are valid ROI, a lot of the other outlined regions are not outlining anything we are interested in. This would make the post-processing of the gradient image difficult since we are not sure if the white pixels are highlighting a region of interest or not.
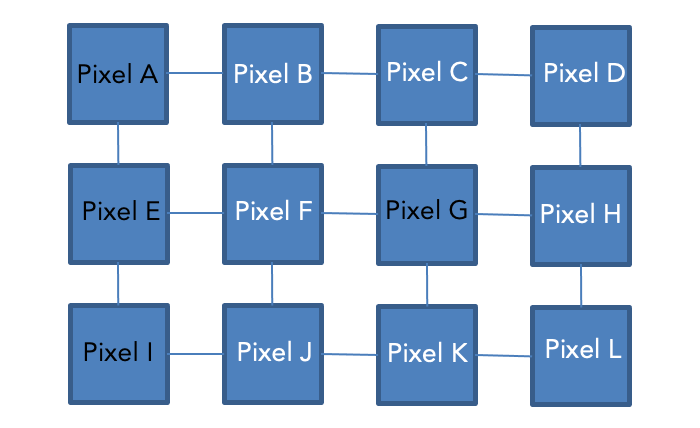
Theoretically, if no noise was captured, we would be able to use the white pixels in the gradient image (above) and a BFS algorithm to locate the edges of all the ROI. then, we could use those enclosures to label the pixels within the inclusions accordingly as well. For instance, in the sample pixel grid on the right, we could iterate over the grid starting from the top-left. When we hit a white pixel that hasn't been seen yet (i.e., pixel b), we could then run a BFS to access all other white pixels connected to this one (representing an ROI), and any pixels within that enclosure. The issue arises when excess noise is in the picture because you cannot determine whether or not a segment is an roi or just noise that the edge detection algorithm captured.
Instance Segmentation via Detectron2
Instance Segmentation is a form of object detection that not only locates objects within an image, but also segments those objects and creates masks that are the size of the original image and represent the pixels for each detected object. Since we would have a mask for each detected "inclusion" or "hole", the masks are exactly what we need to extract pixels for ROI.
I first had to test the efficacy of instance segmentation when there is a relatively low number of training images used to train the model (while many detection models have training datasets that have hundreds of thousands of images), our current dataset had less than one hundred. Thus, I developed a dummy dataset of simple shapes in order to see if a low amount of training data could, theoretically, allow for an accurate detection model.
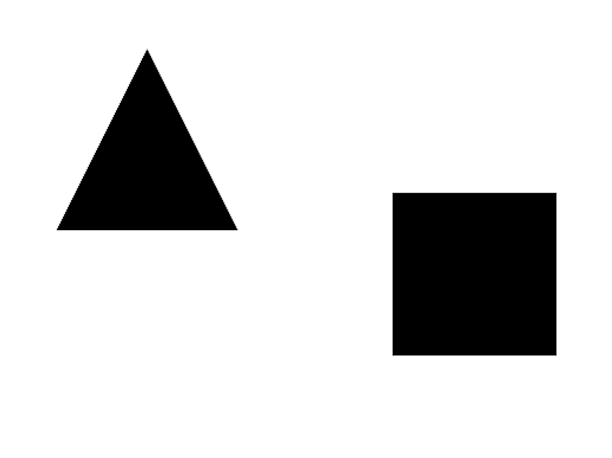
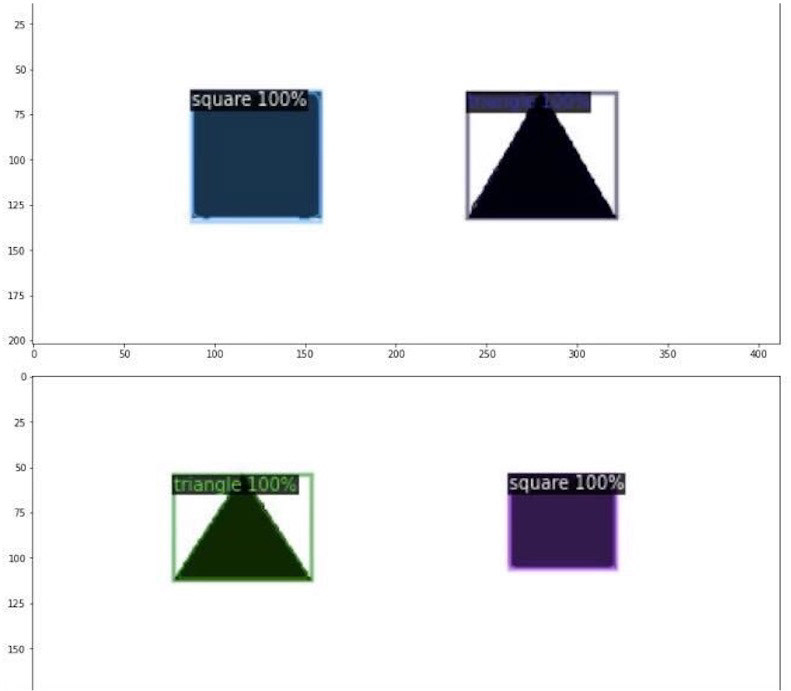
After training on just 20 images, the instance segmentation model was able to distinguish and segment between simple shapes such as squares and triangles with nearly 100% accuracy. It's worth giving this method a shot for some more complex shapes like "holes", "inclusions", and "edges"!
Procedure for Detectron2 Instance Segmentation
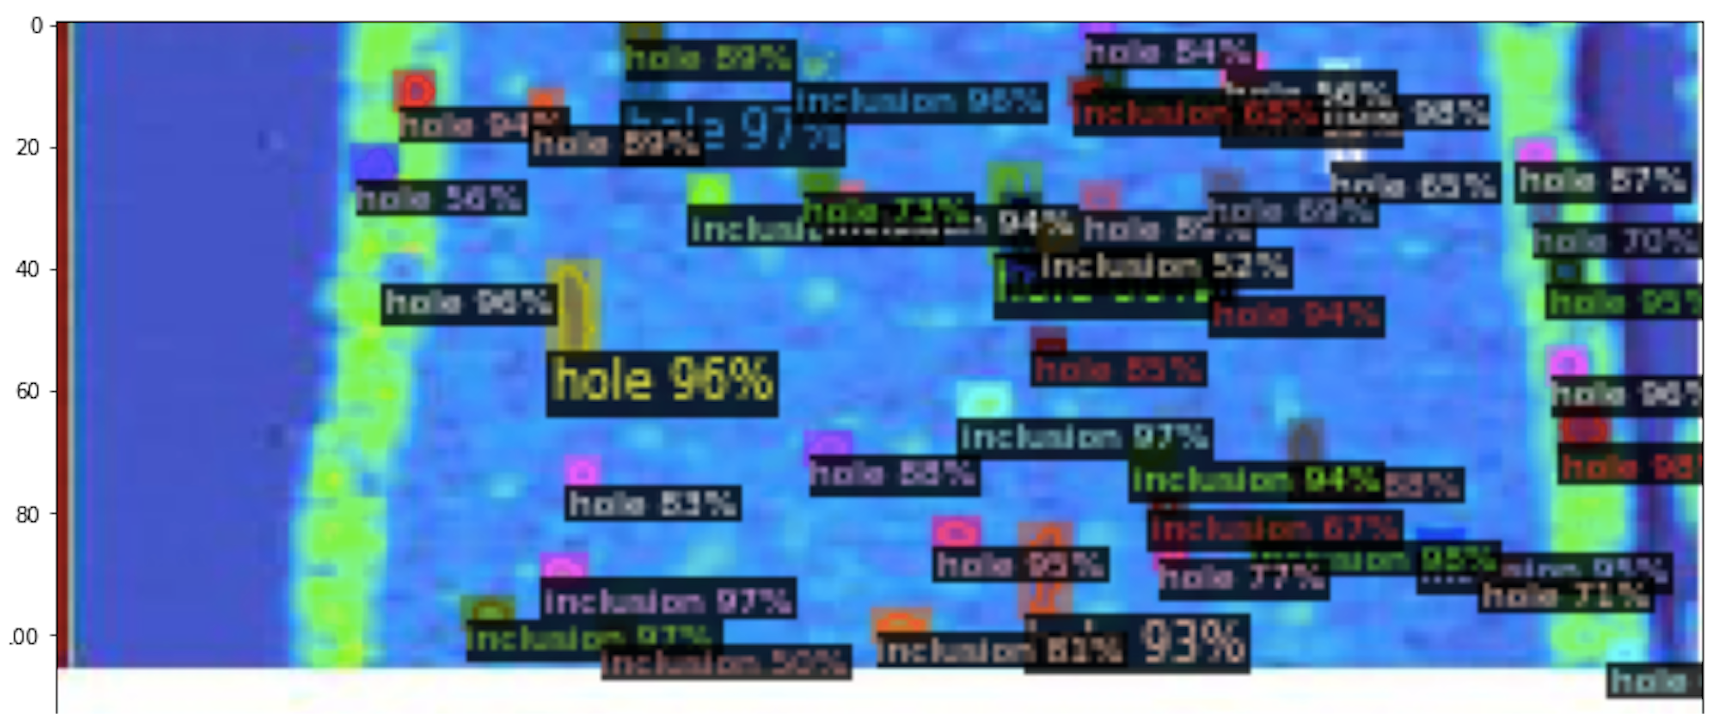
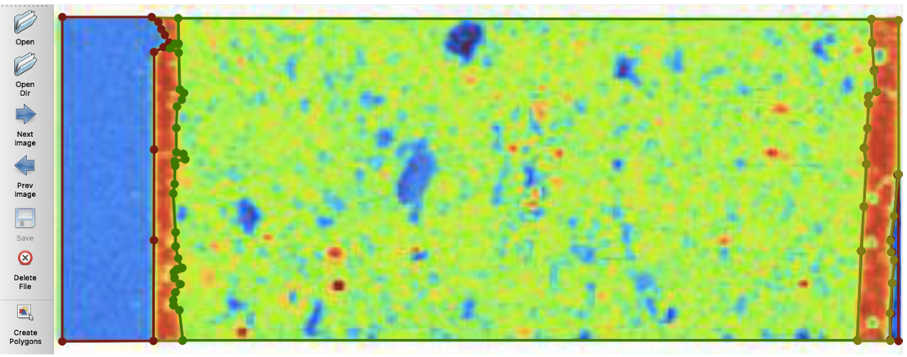
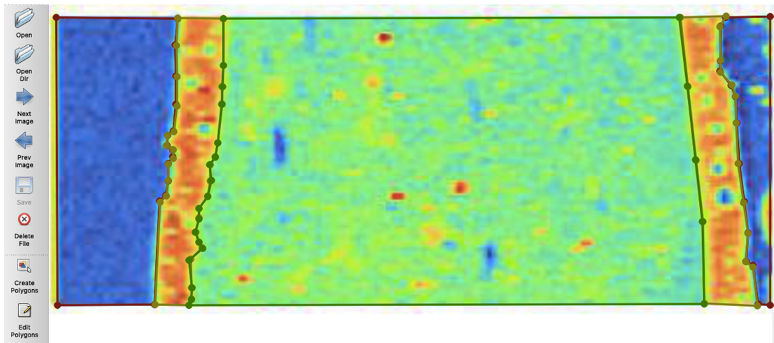
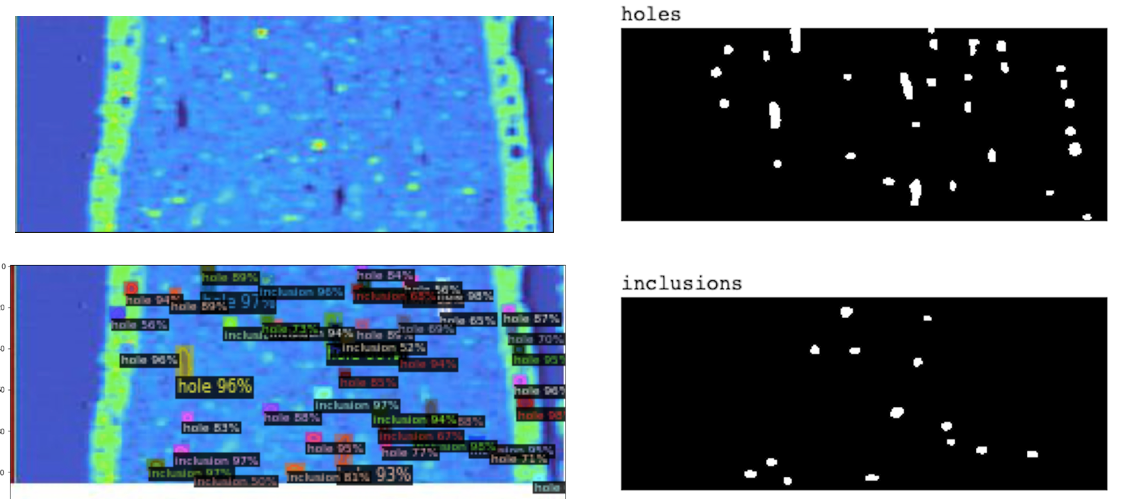
I used Labelme, a Python GUI that allows you to annotate images and outline objects, which produces a json file for each image detailing the outlined regions in the image for the model to take in during training. These images must be manually labeled and annotated. Notice that in the image to the left, the labeled segments were inclusions and holes, and in the two images Below, the labeled segments were the edges of the ceramic glaze.
We could also extract masks for each of the different features we are identifying. For example, in the scan below, the top-right image represents the "holes" that the model identified and the bottom-right image represents the "inclusions" that the model identified. The masks allow us to determine the exact pixels in the image that correspond with a feature. Knowing this will allow us to conduct comparisons across channels at a pixel level.
I ran the same for the model detecting edges


For this Instance Segmentation Model, we had 3 classes: Outside, inside, and edges.
Metrics
Sample metrics on CBGS Liquor Bottle (Sample LB3, Mn Channel) for Edges/Glaze test
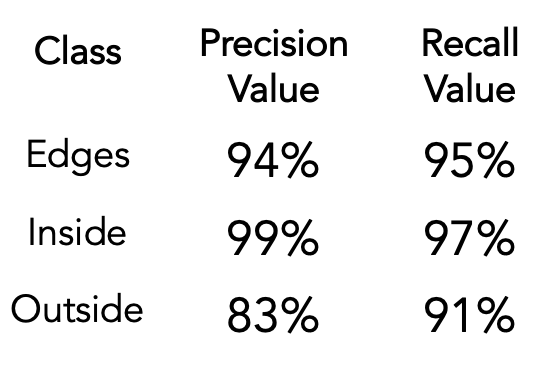
Precision is the percent of pixels predicted as a certain class by the model that truly belong to that class, and recall is the percent of all pixels of a certain class that the model found. All 3 classifications had high recall, meaning the model found almost all regions classified as “edges”, ”inside”, and “outside” that were present in the sample. The model predicted “edges” and “inside” pixels very accurately, but it predicted some false positives (FPs) for ”outside” pixels/regions (more training data can reduce this). In our context, FPs are pixels that were labeled incorrectly, and true positives (TPs) are correctly labeled pixels. Overall, the model is accurate and precise at detecting ROI. More training data will only enhance its capabilities.